ShareThis transforms real-time web engagement into actionable insights, and Shar.es makes it effortless—turning complex data into intuitive dashboards and AI-powered visuals, without users needing to wrangle data themselves.
1 PM
3 Developers
2 Designers
8 months
Figma
Figma, Adobe Illustrator, Design Systems, Data Visualization, Interaction Design, Responsive Web Design, UX Strategy, A/B Testing, Branding

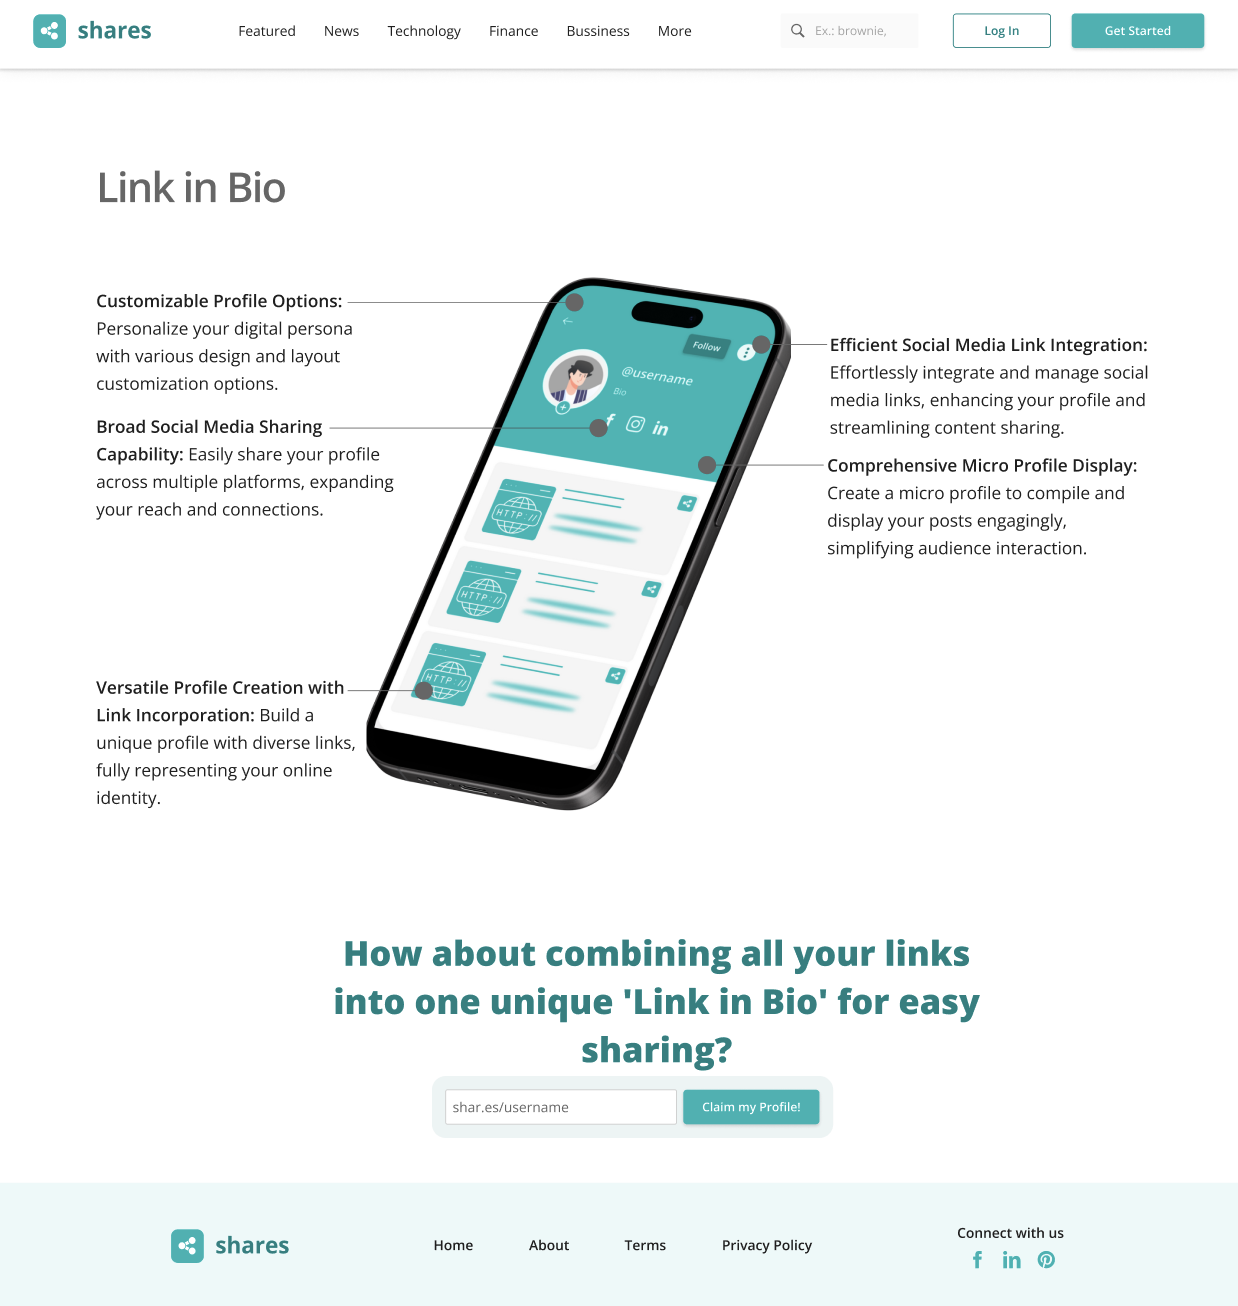
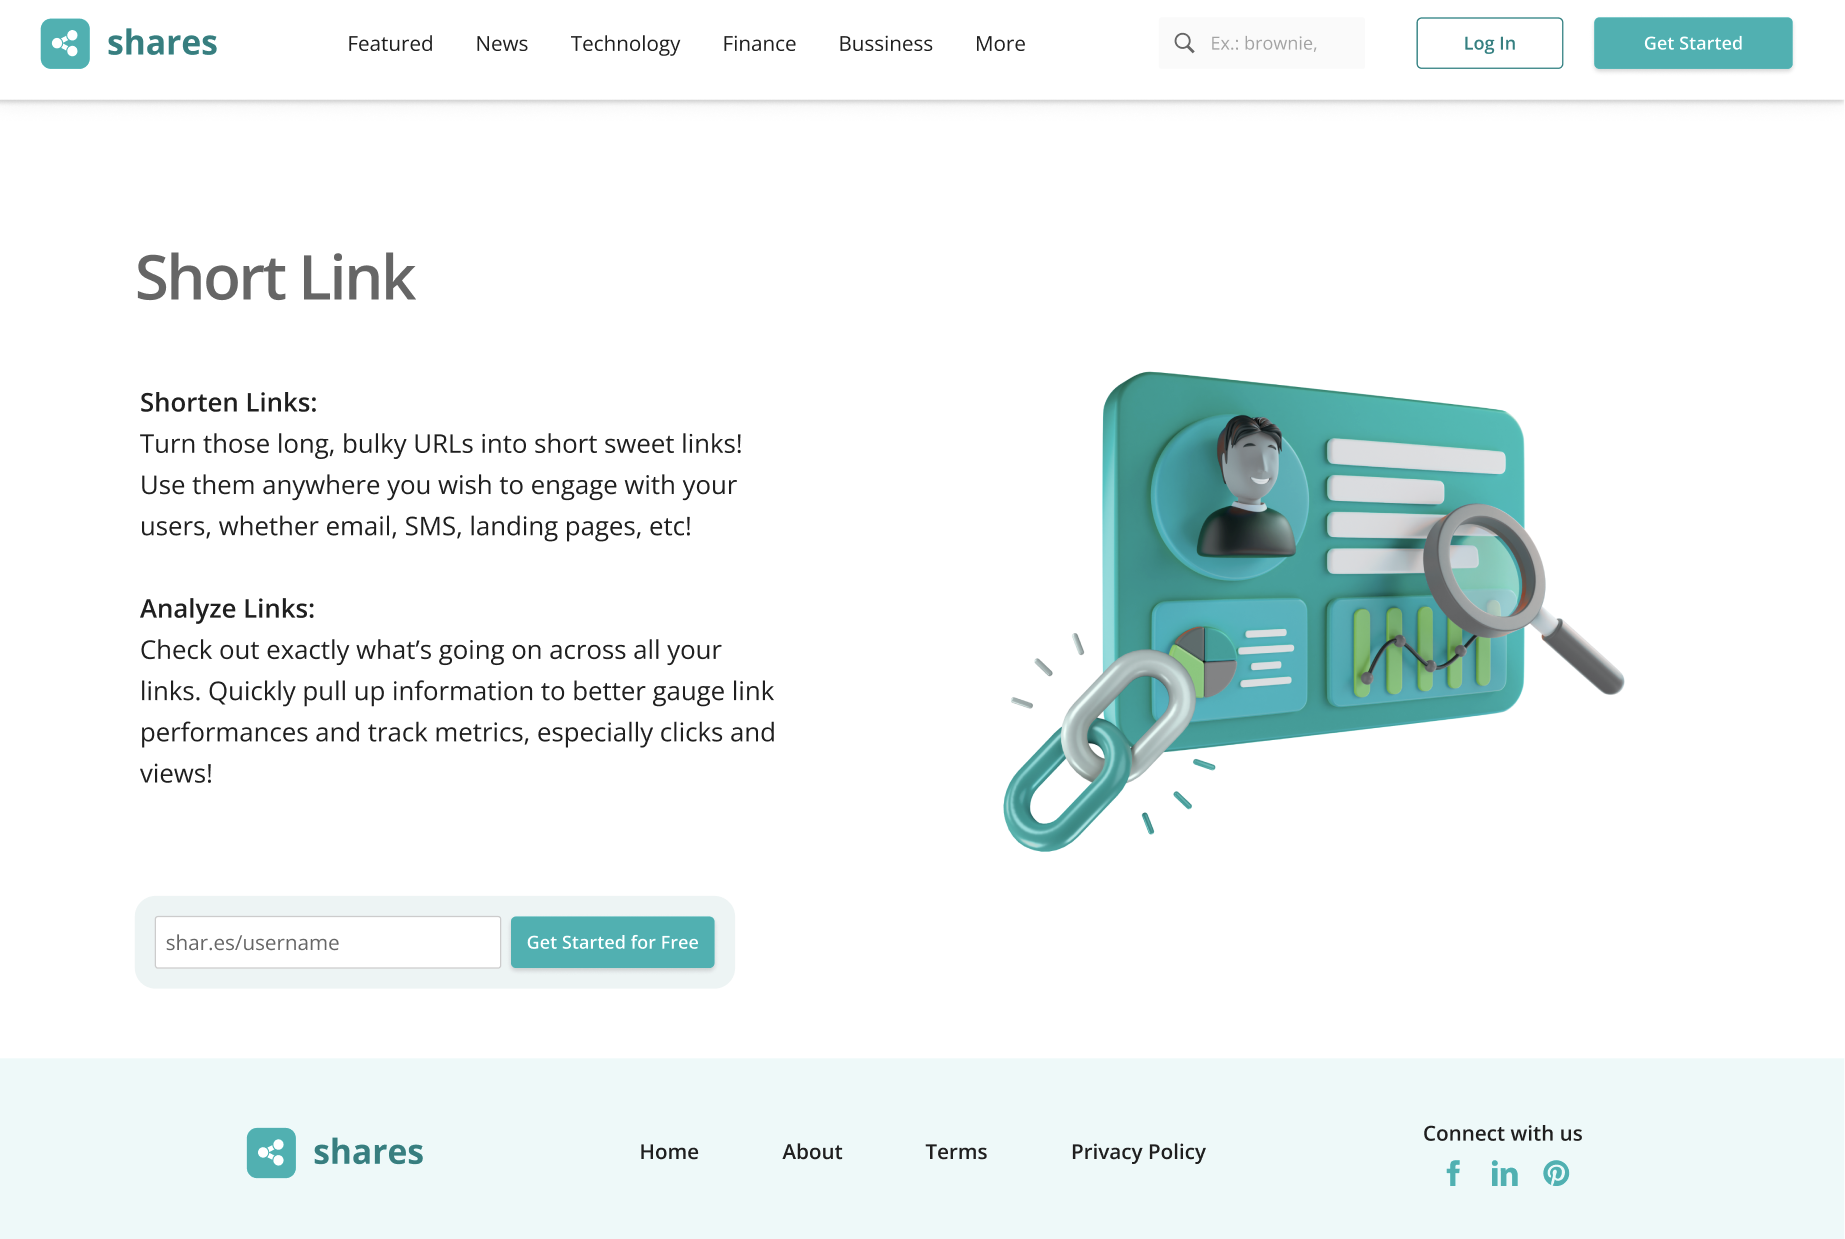
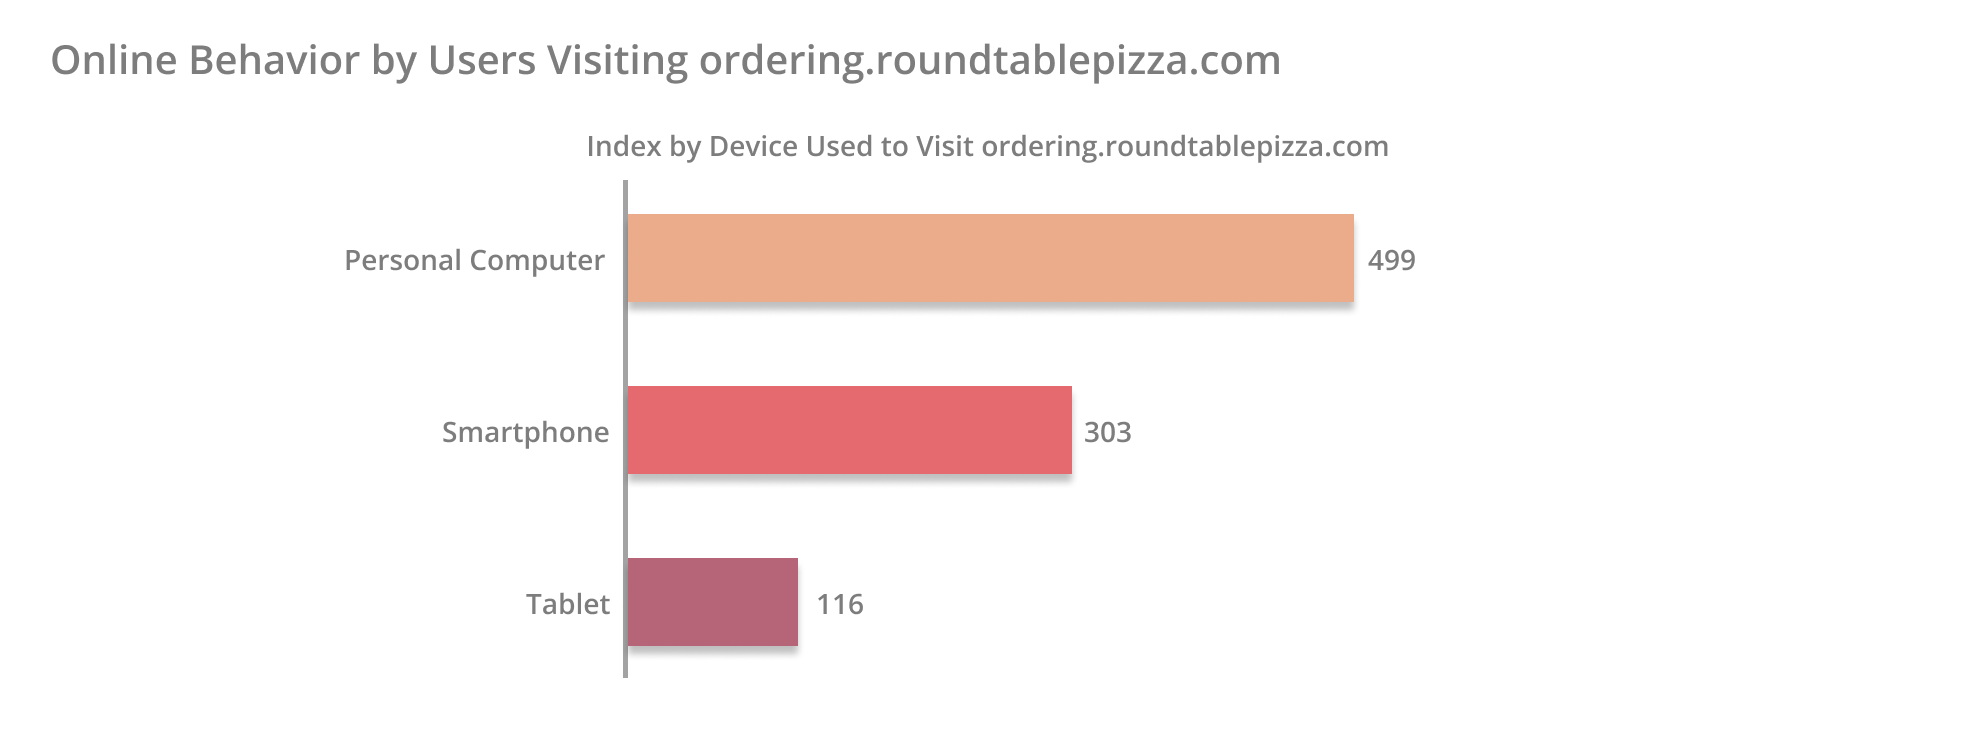
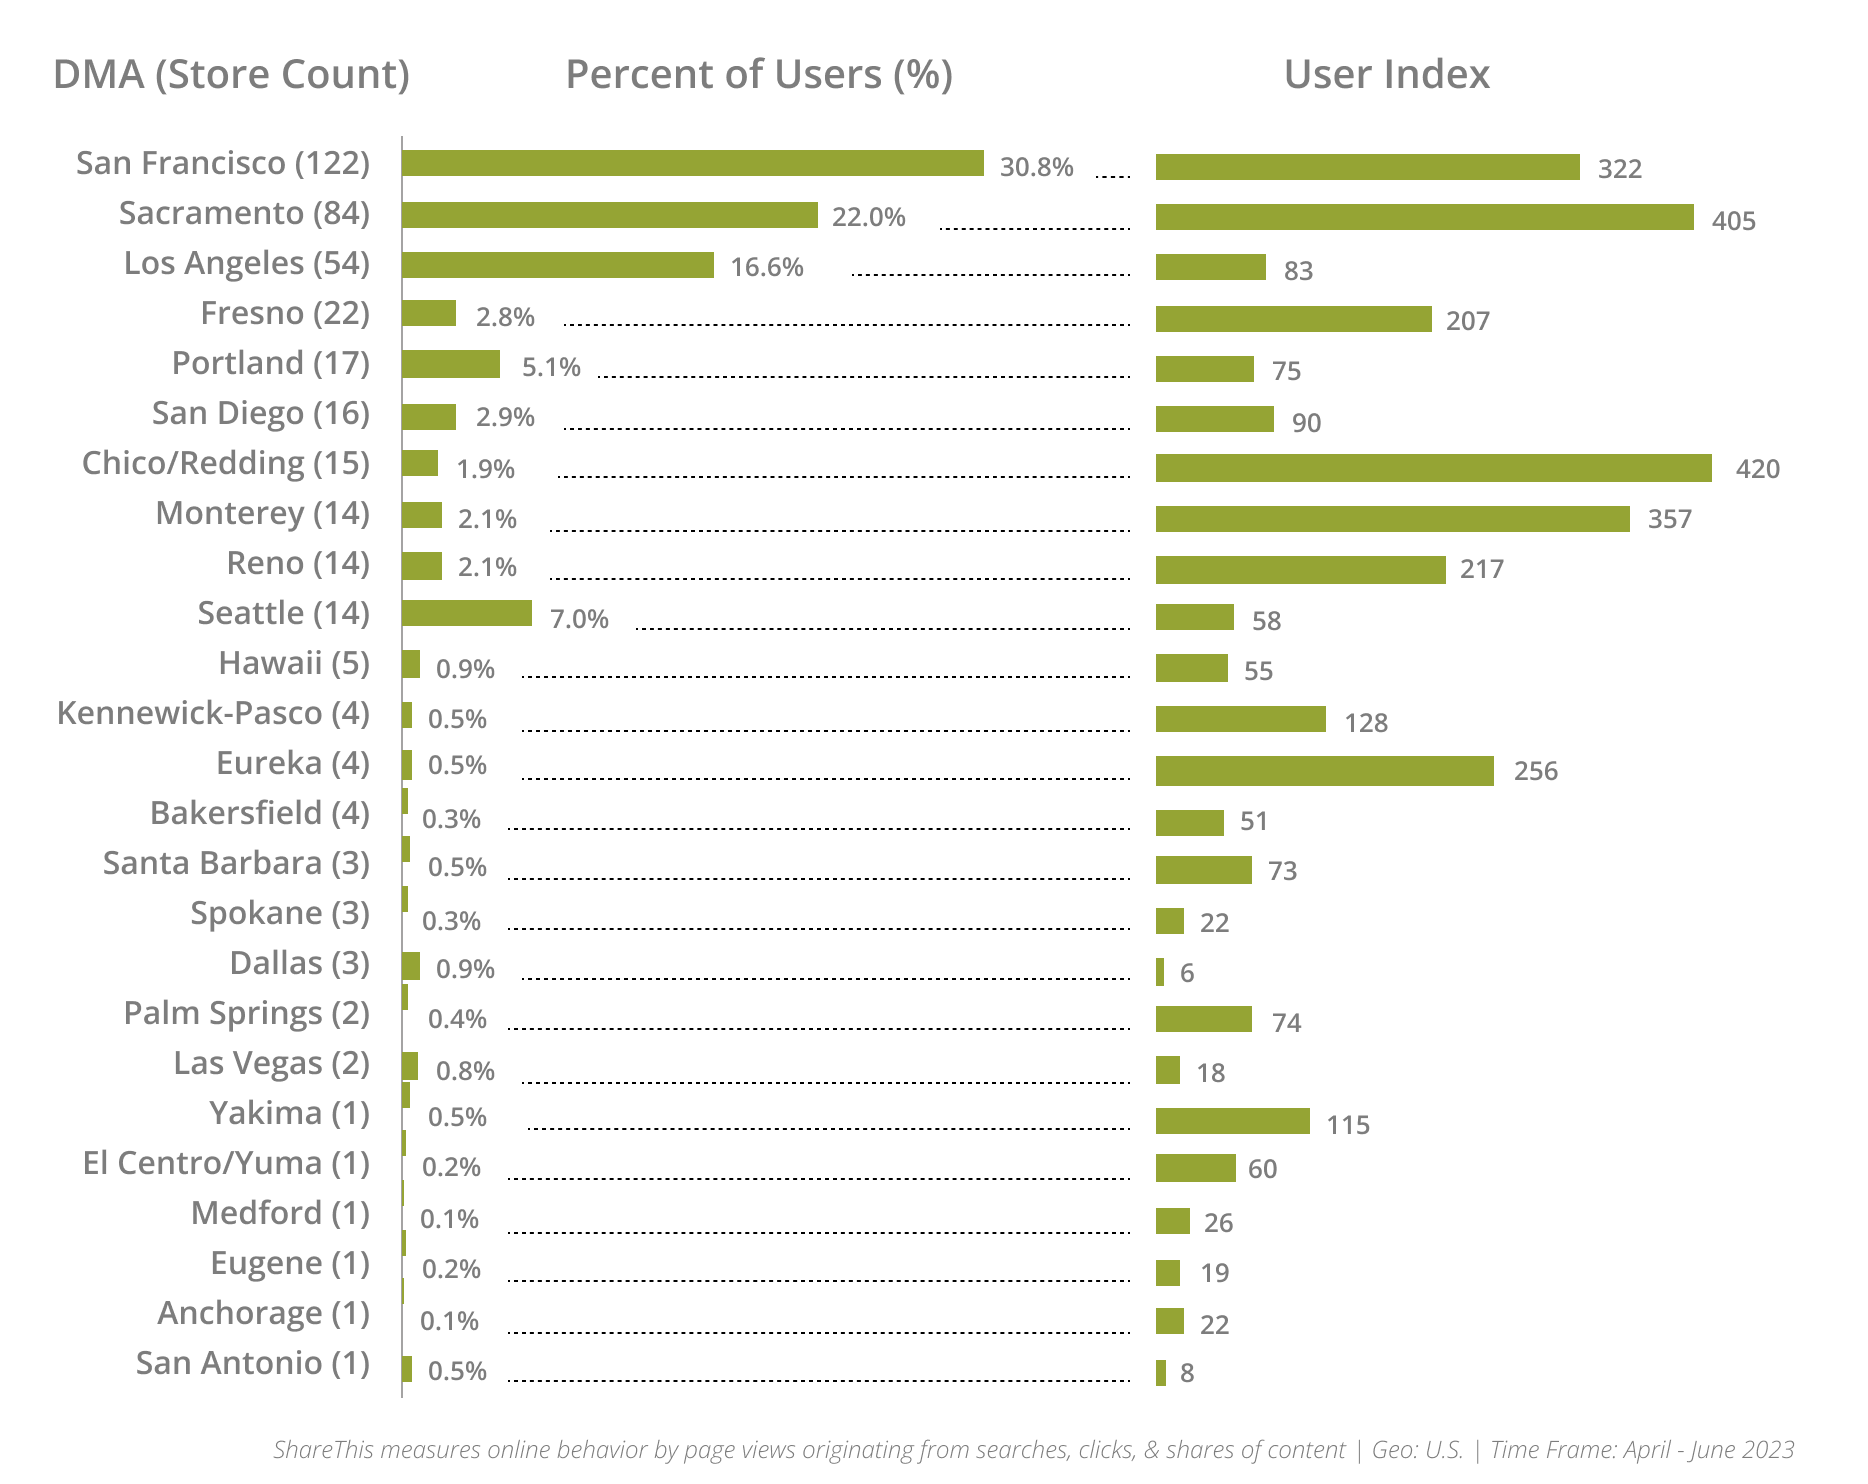
Redesigned the core ShareThis website dashboards for both mobile and desktop to be more user-friendly and visually modern—introducing design techniques like shadows, hover states, and dynamic hide/show interactions to create a cleaner, more intuitive experience that encouraged exploration and deeper engagement.
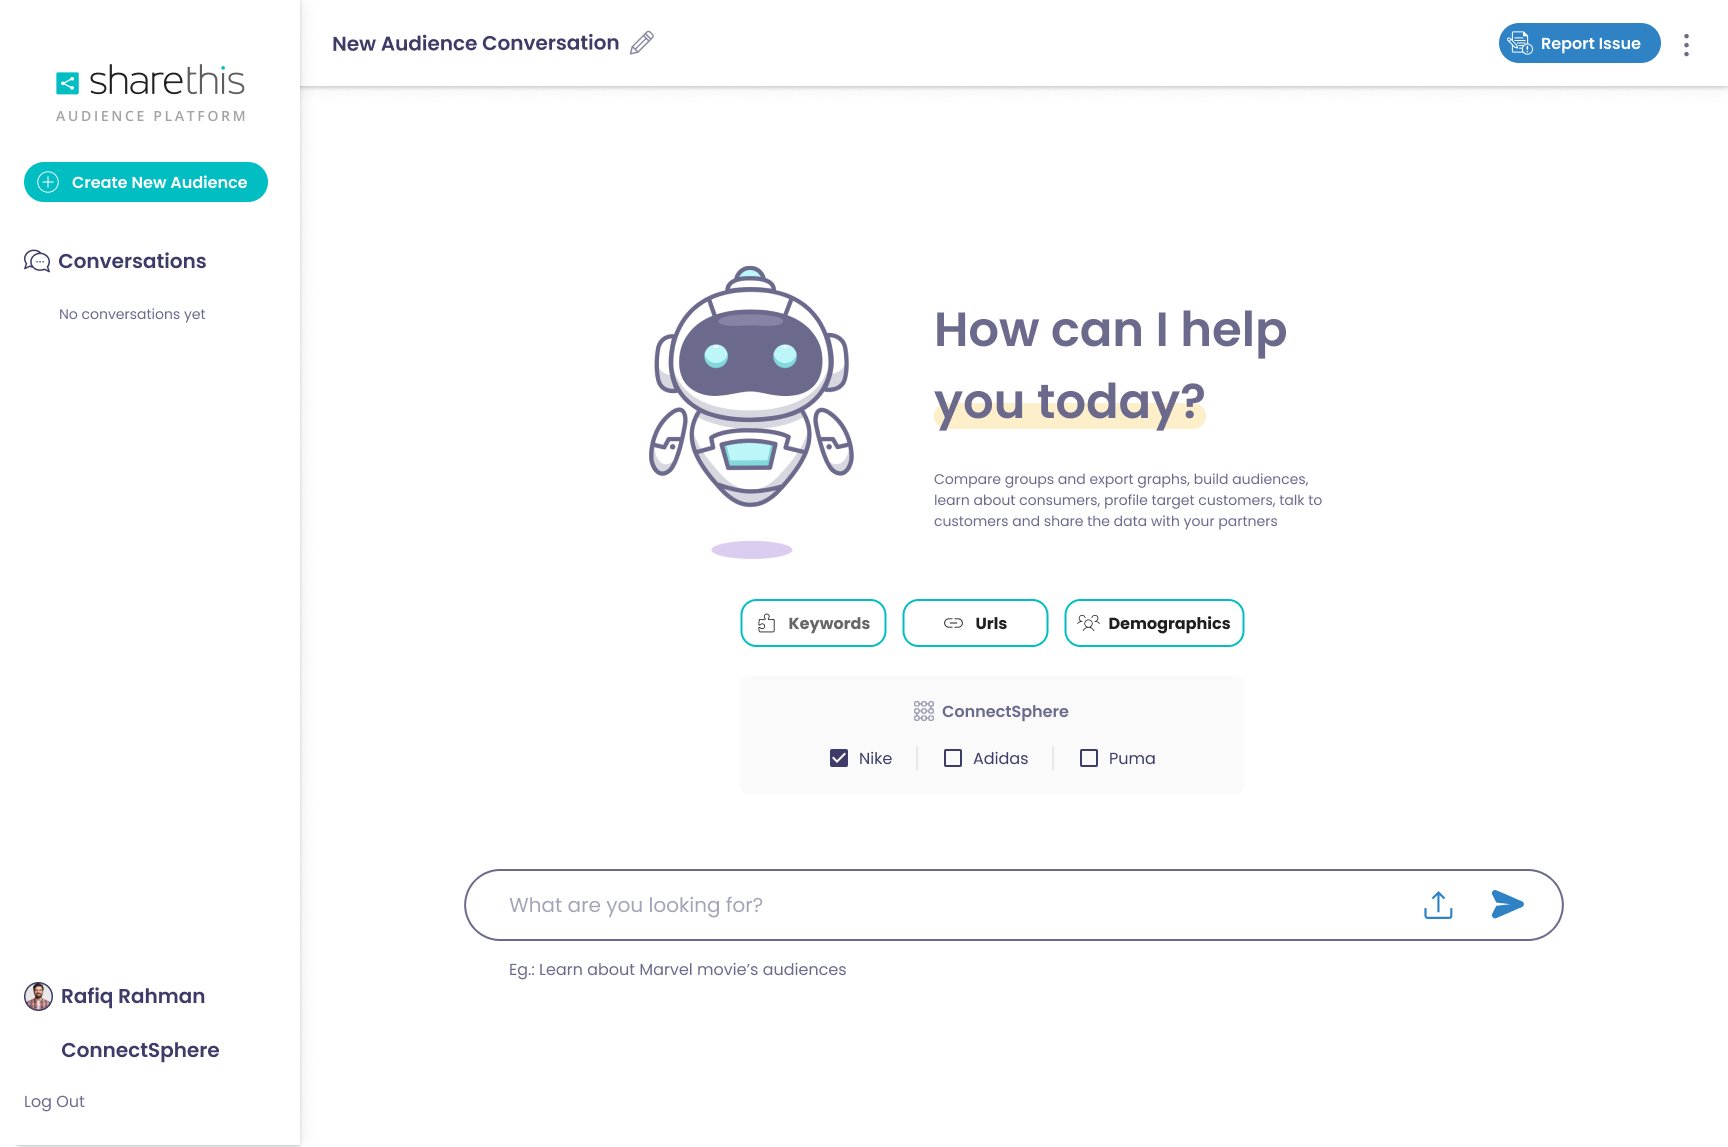
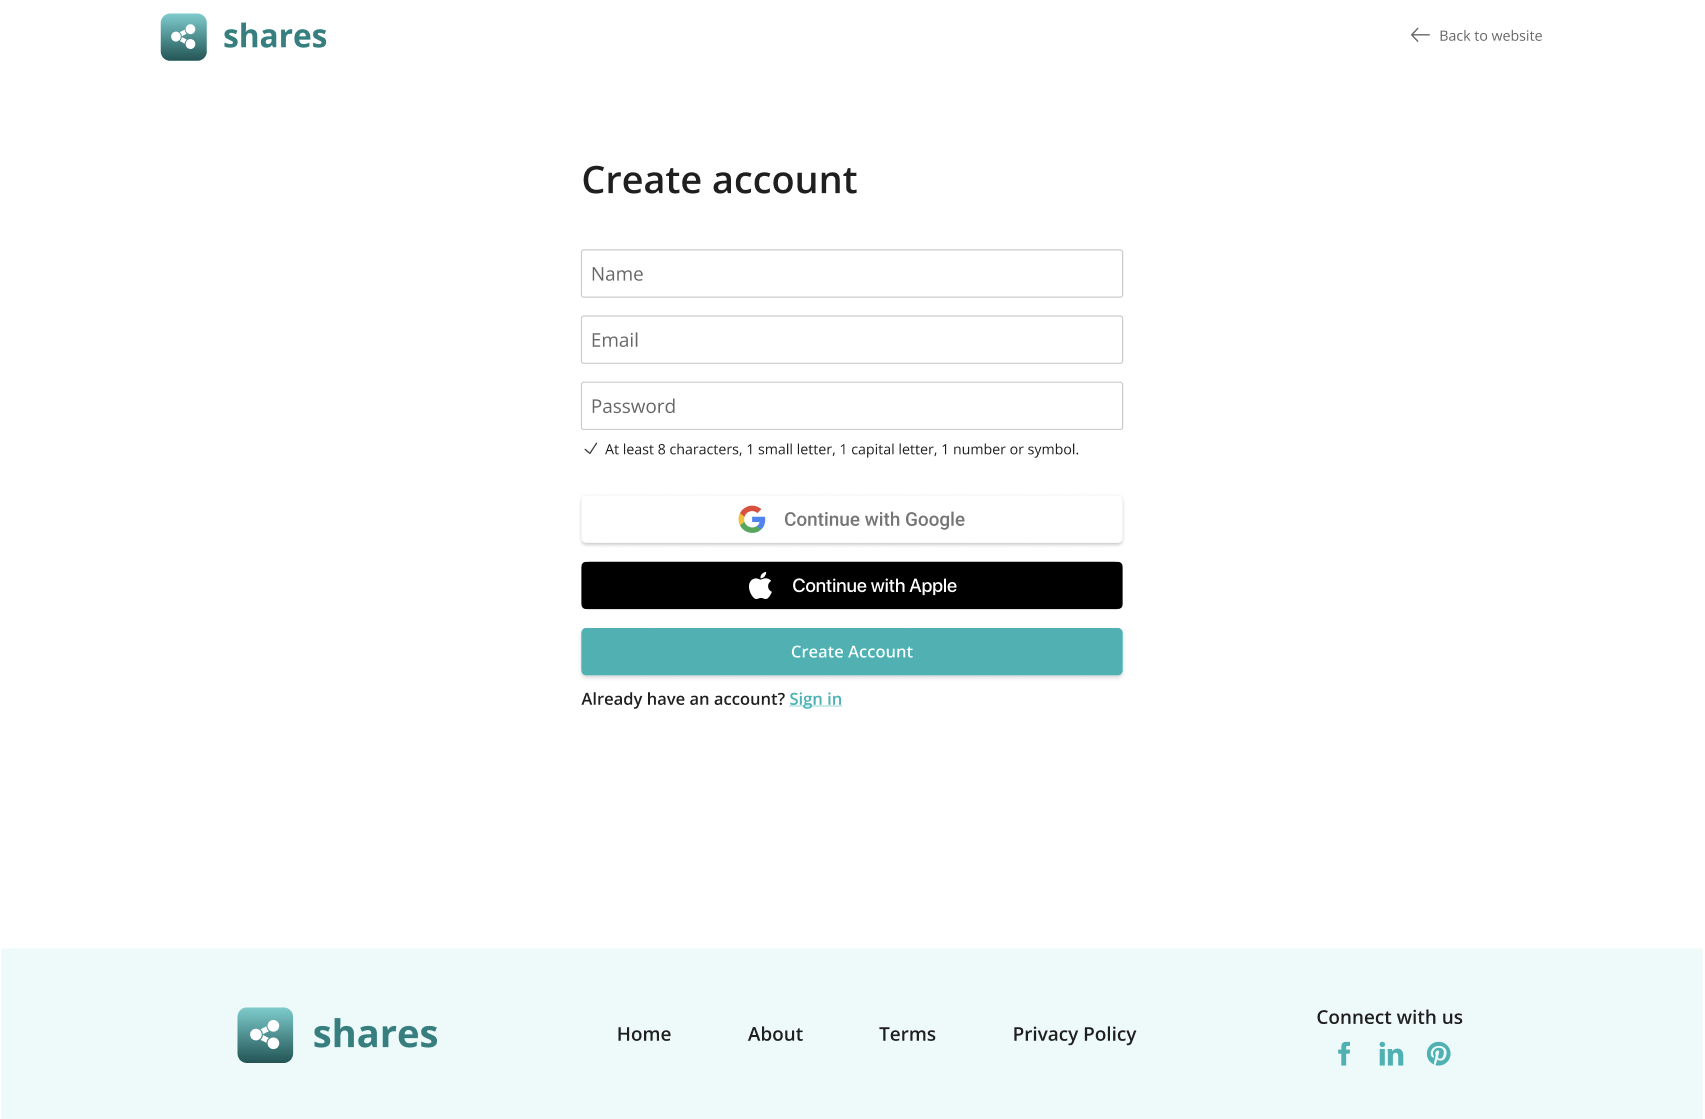
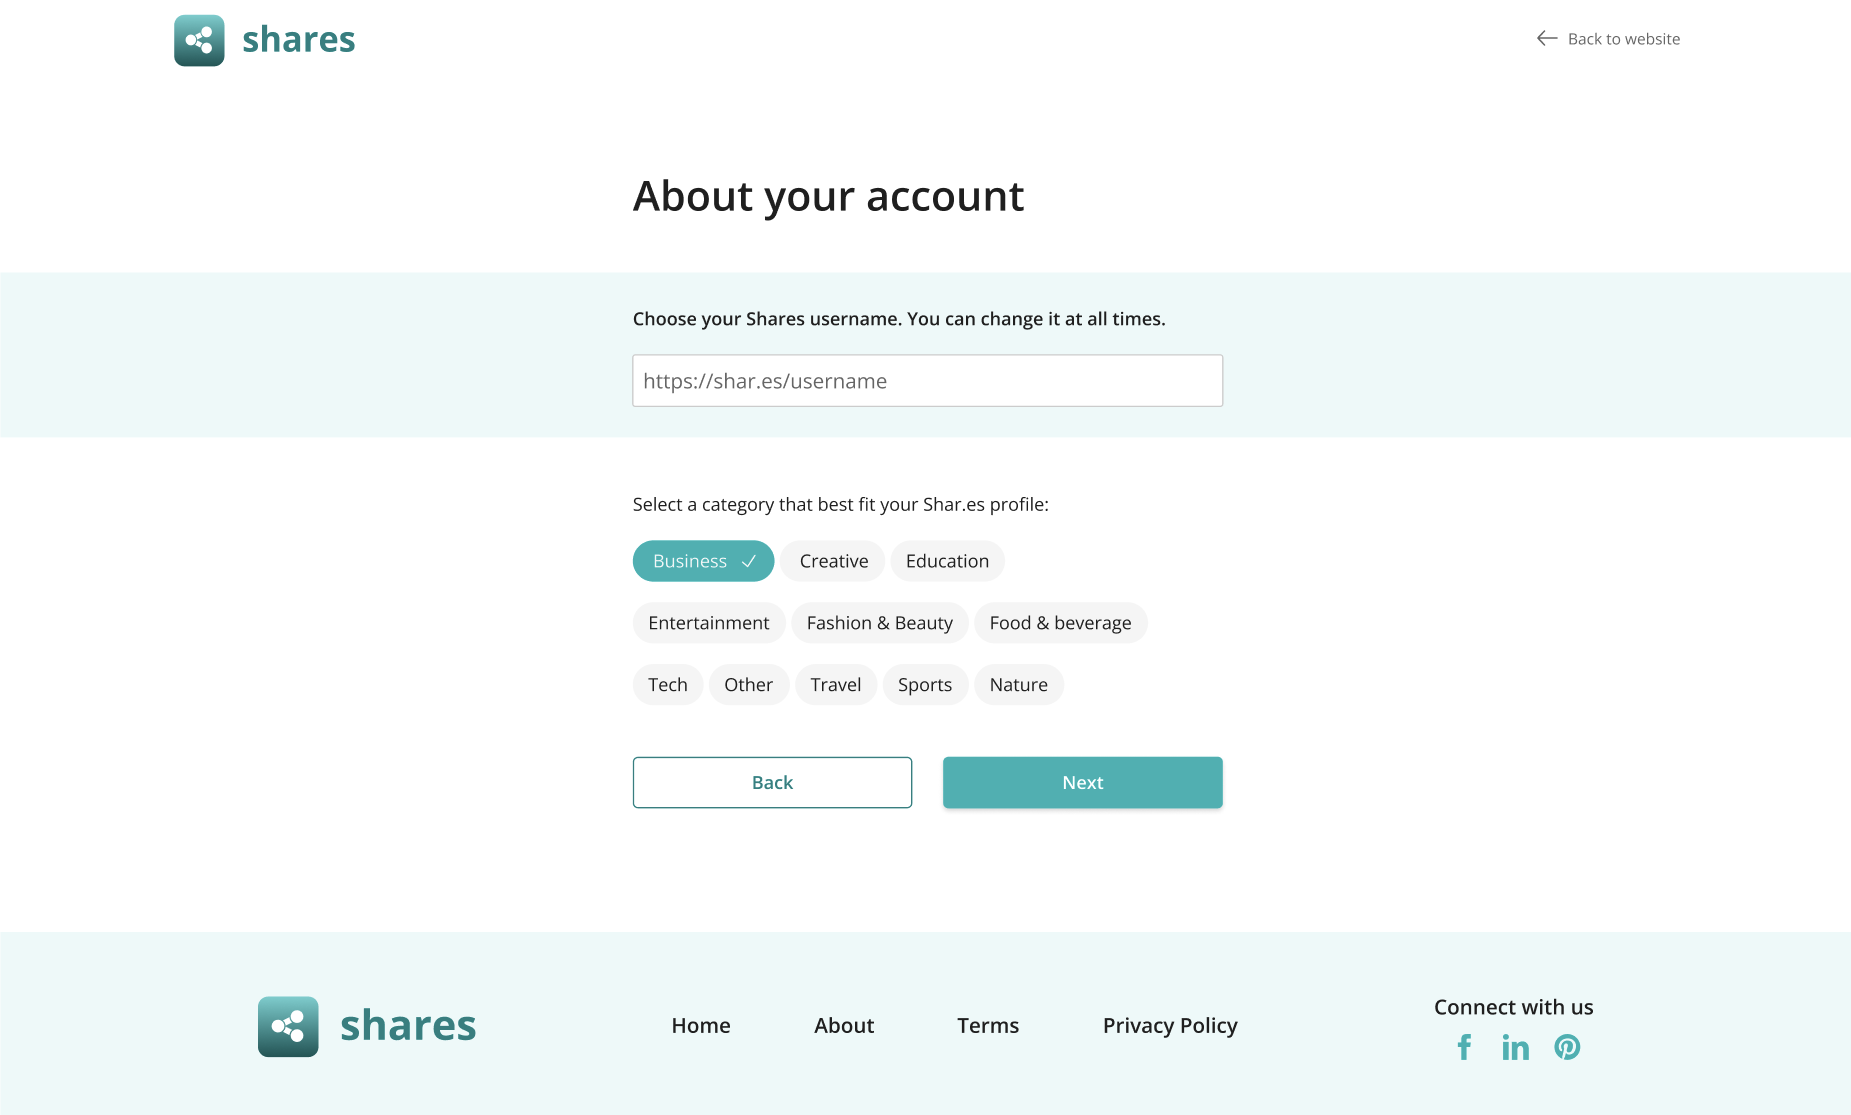
Led the UX/UI for Shares, an AI-powered chat bot and dashboard where companies could input their data and instantly receive tailored insights. Crafted seamless flows that made advanced analytics approachable, blending conversational AI with rich data visuals.
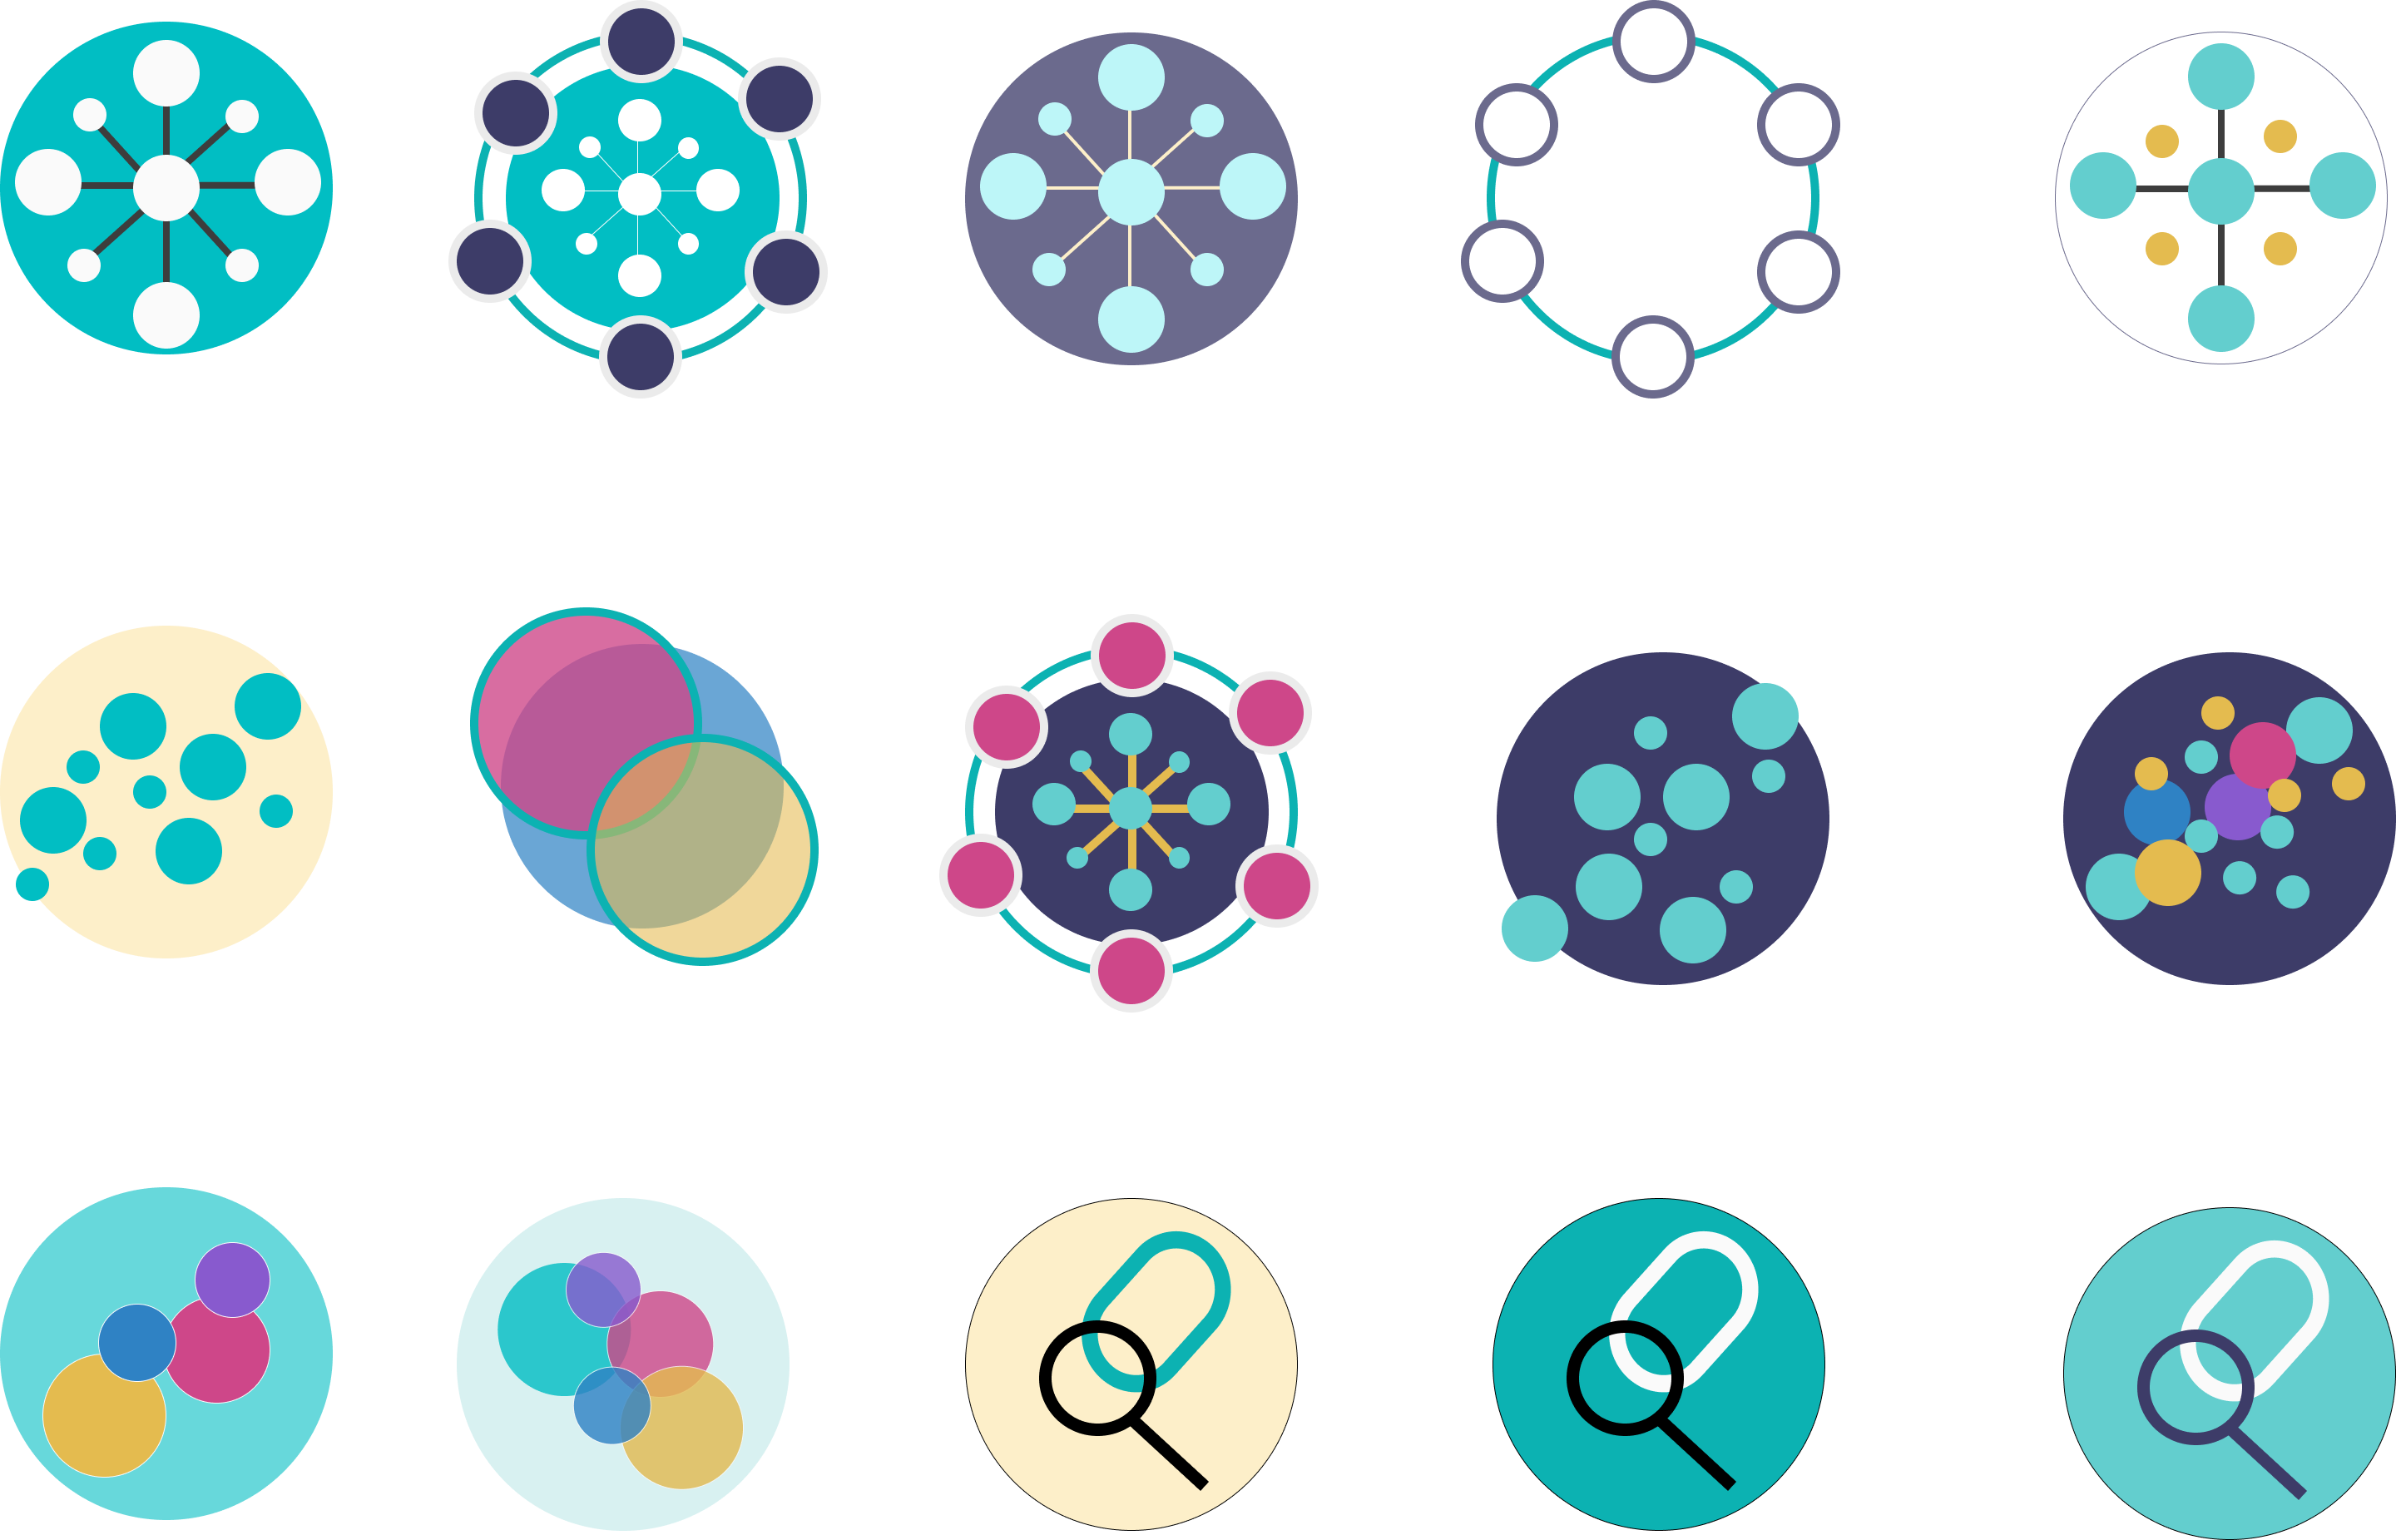
Developed the specialized Connect logo and visual system embedded within the dashboard experience, reinforcing brand identity while providing a cohesive, trustworthy interface for exploring interconnected datasets.
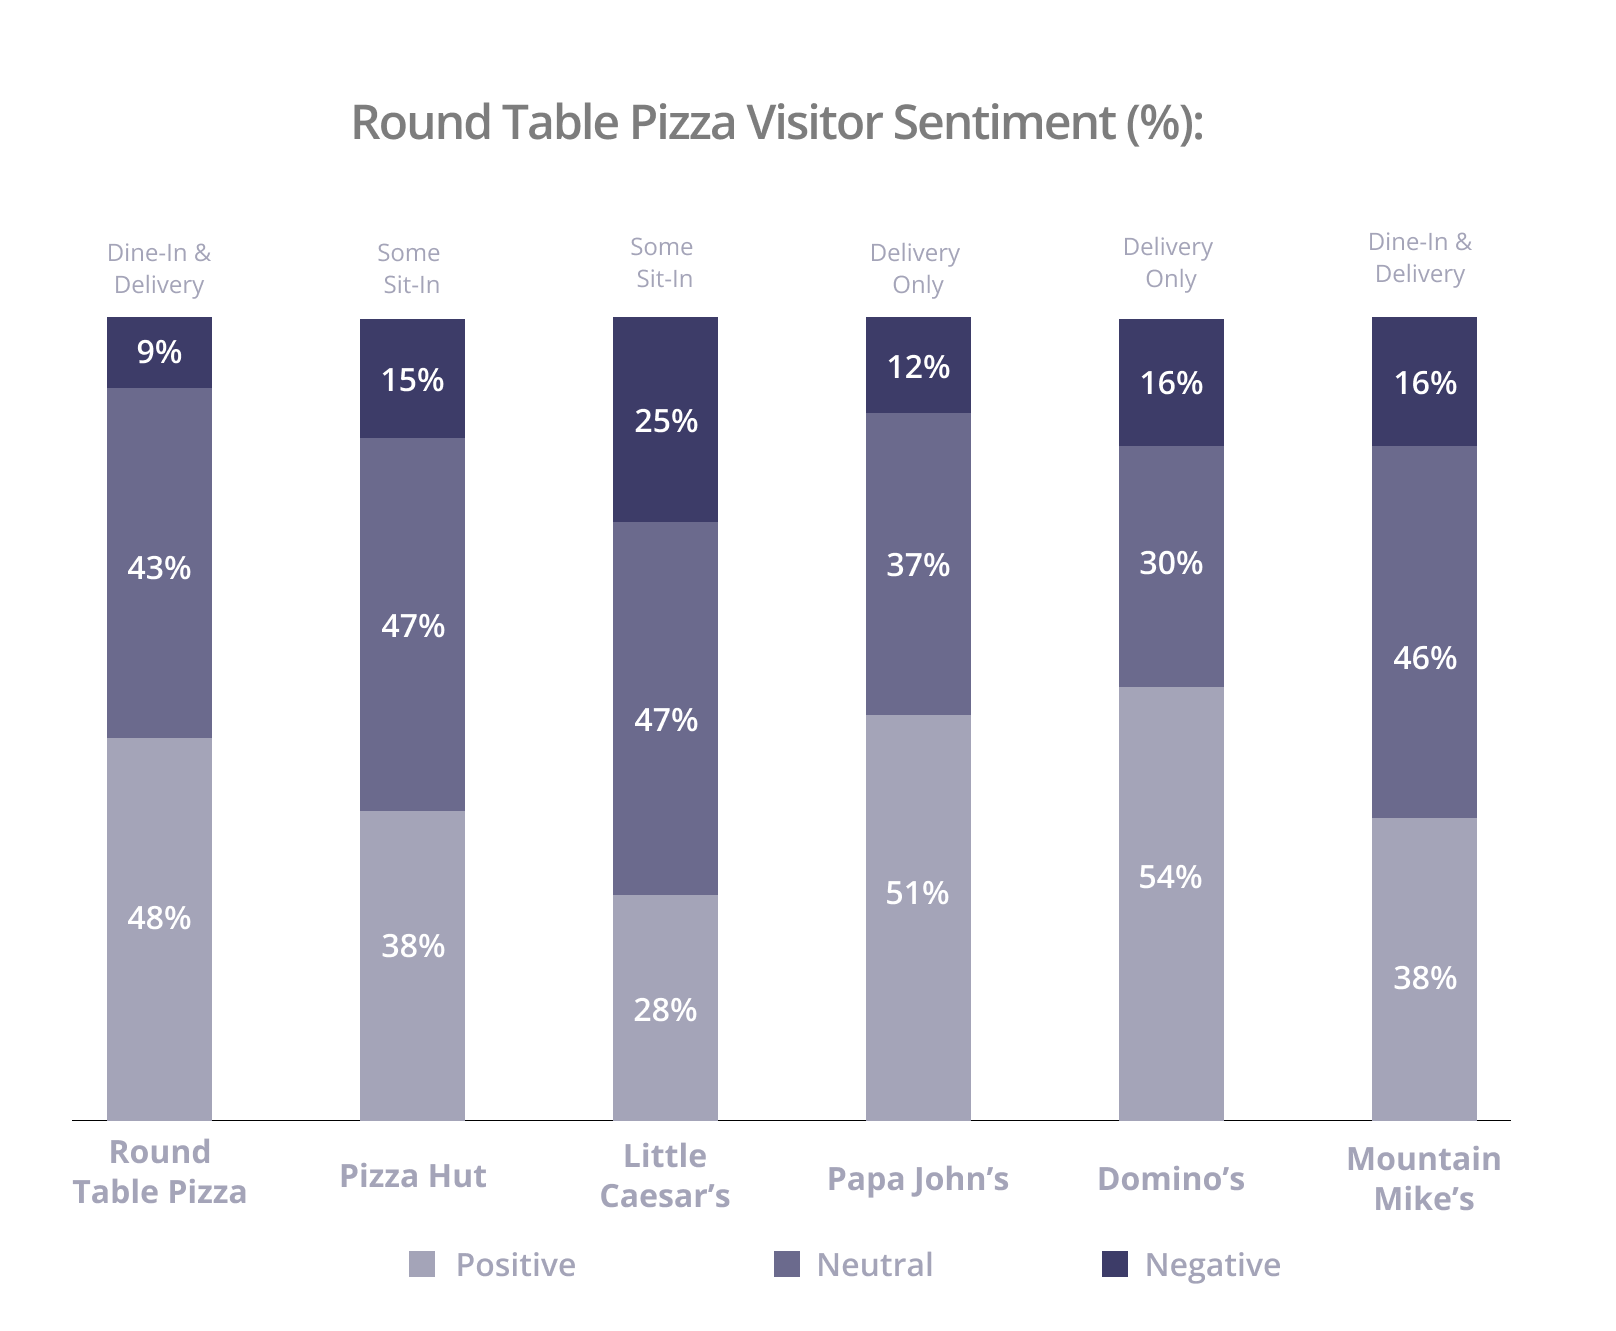
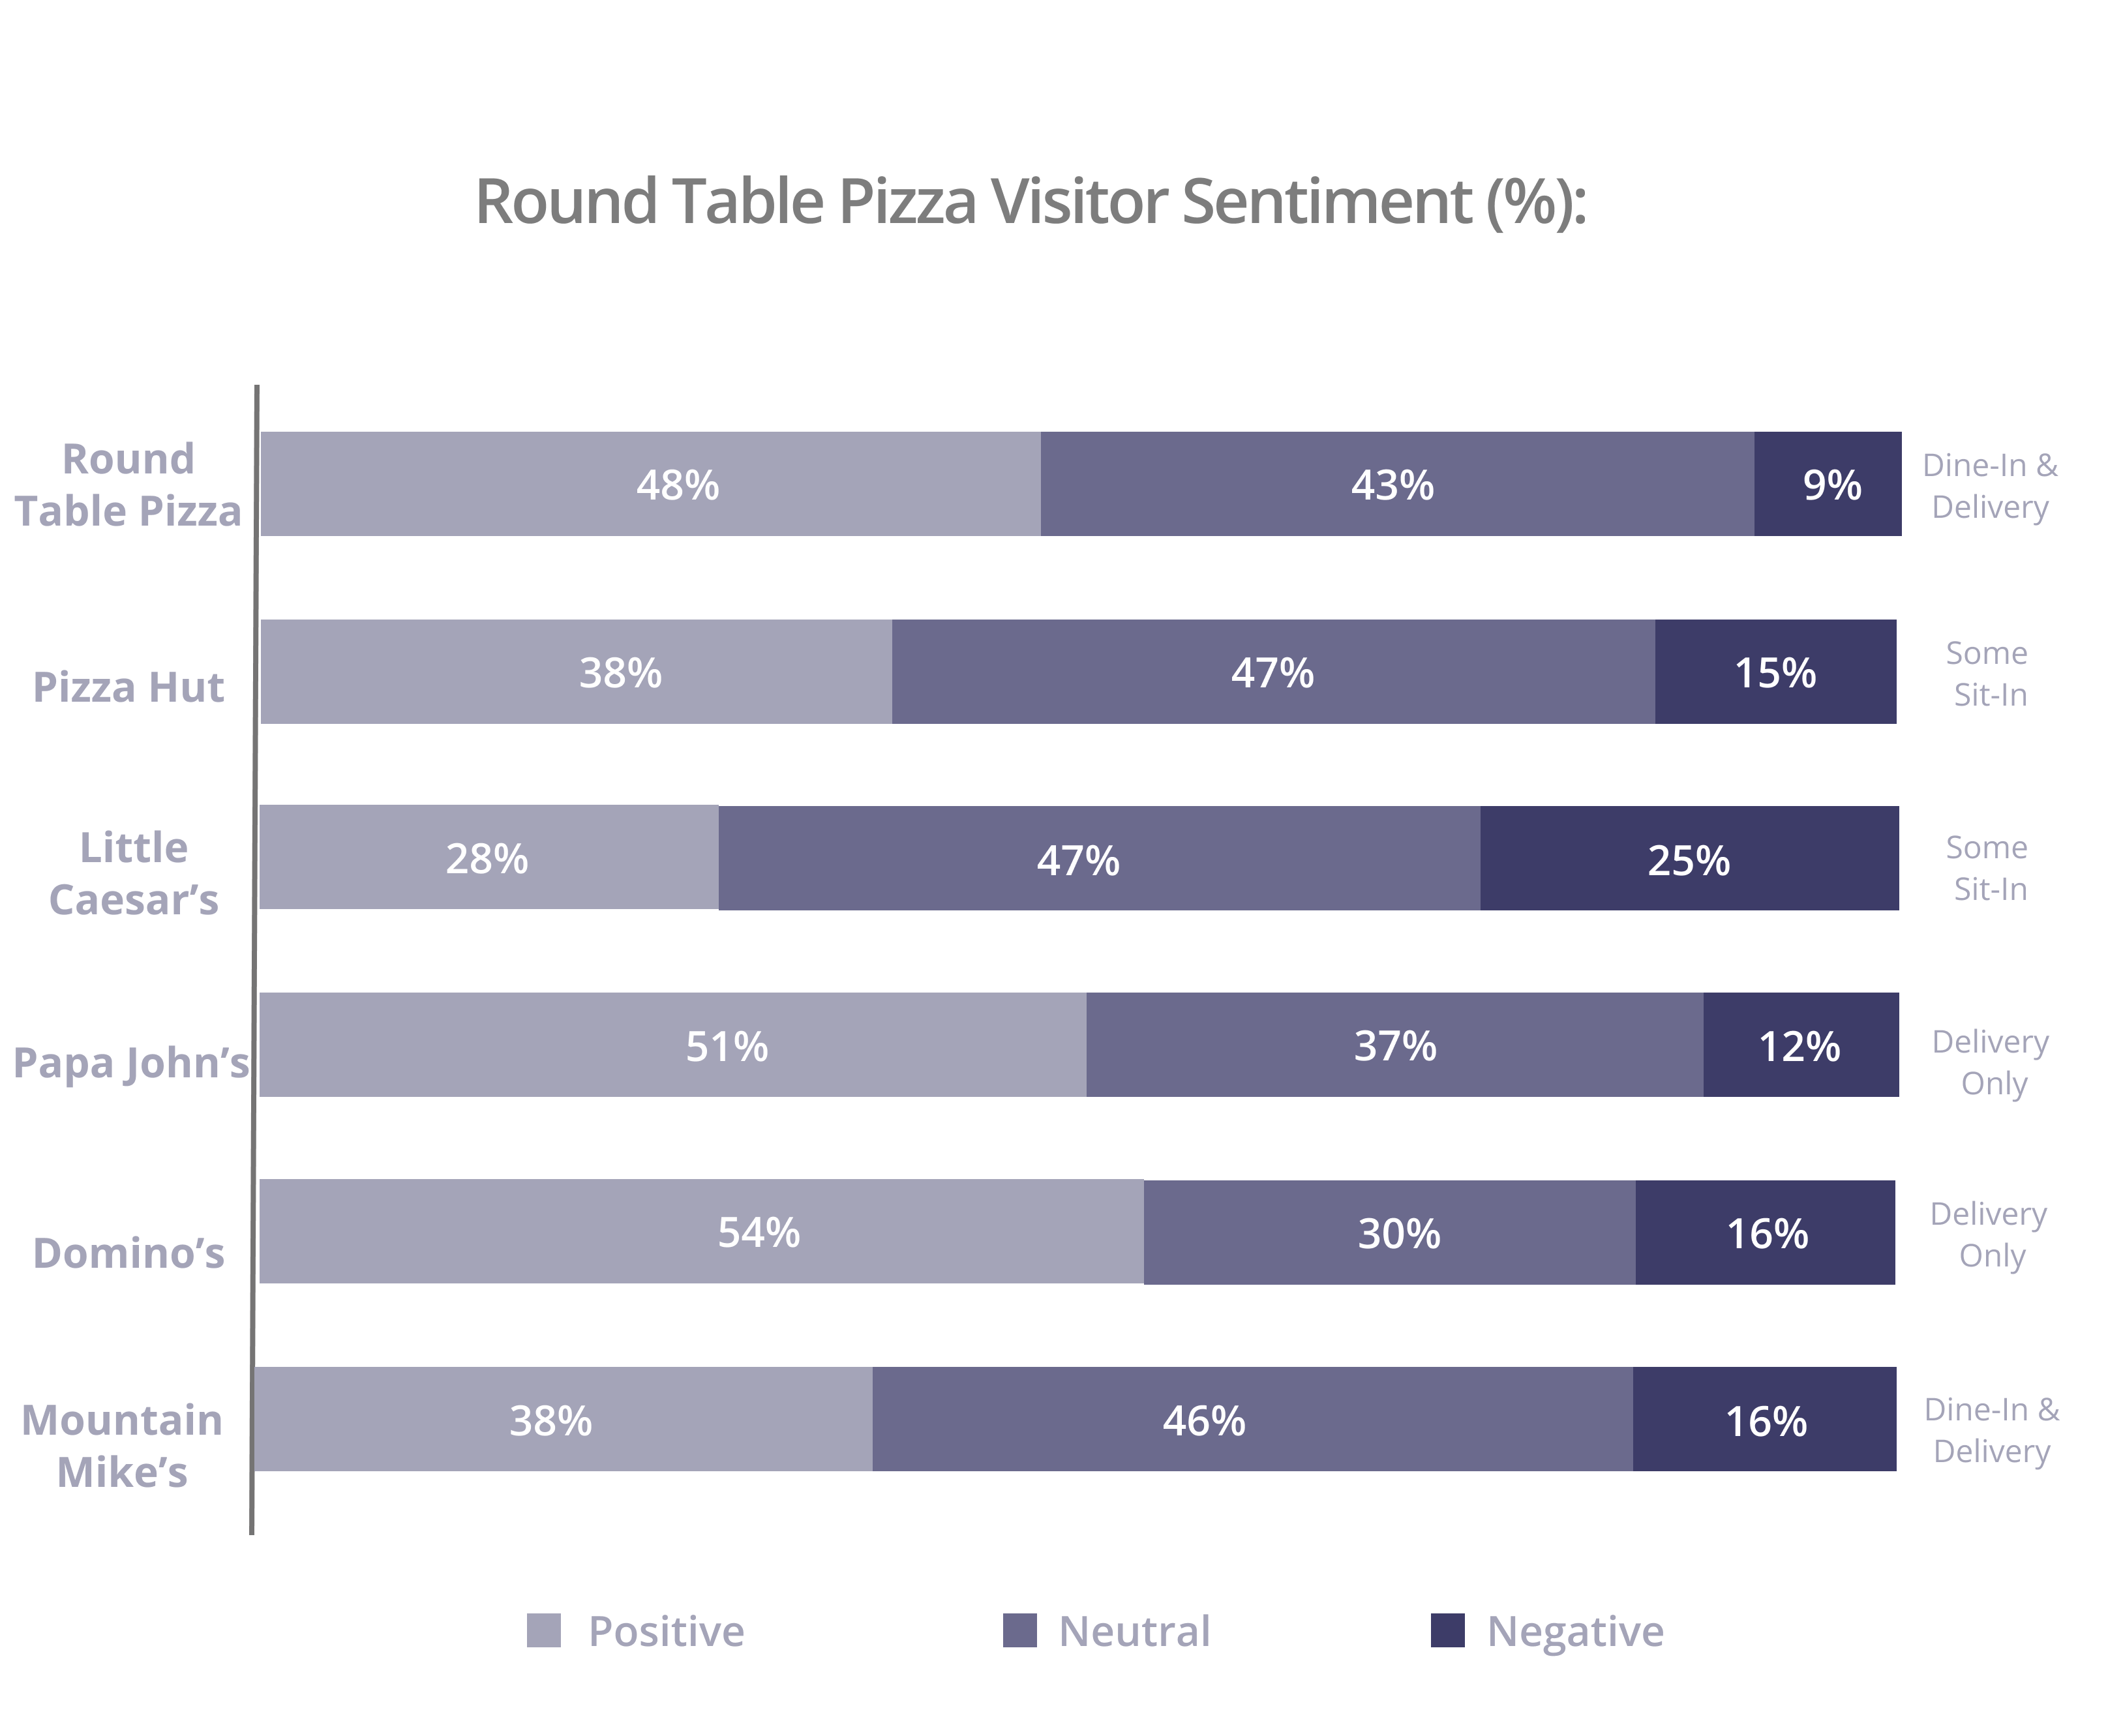
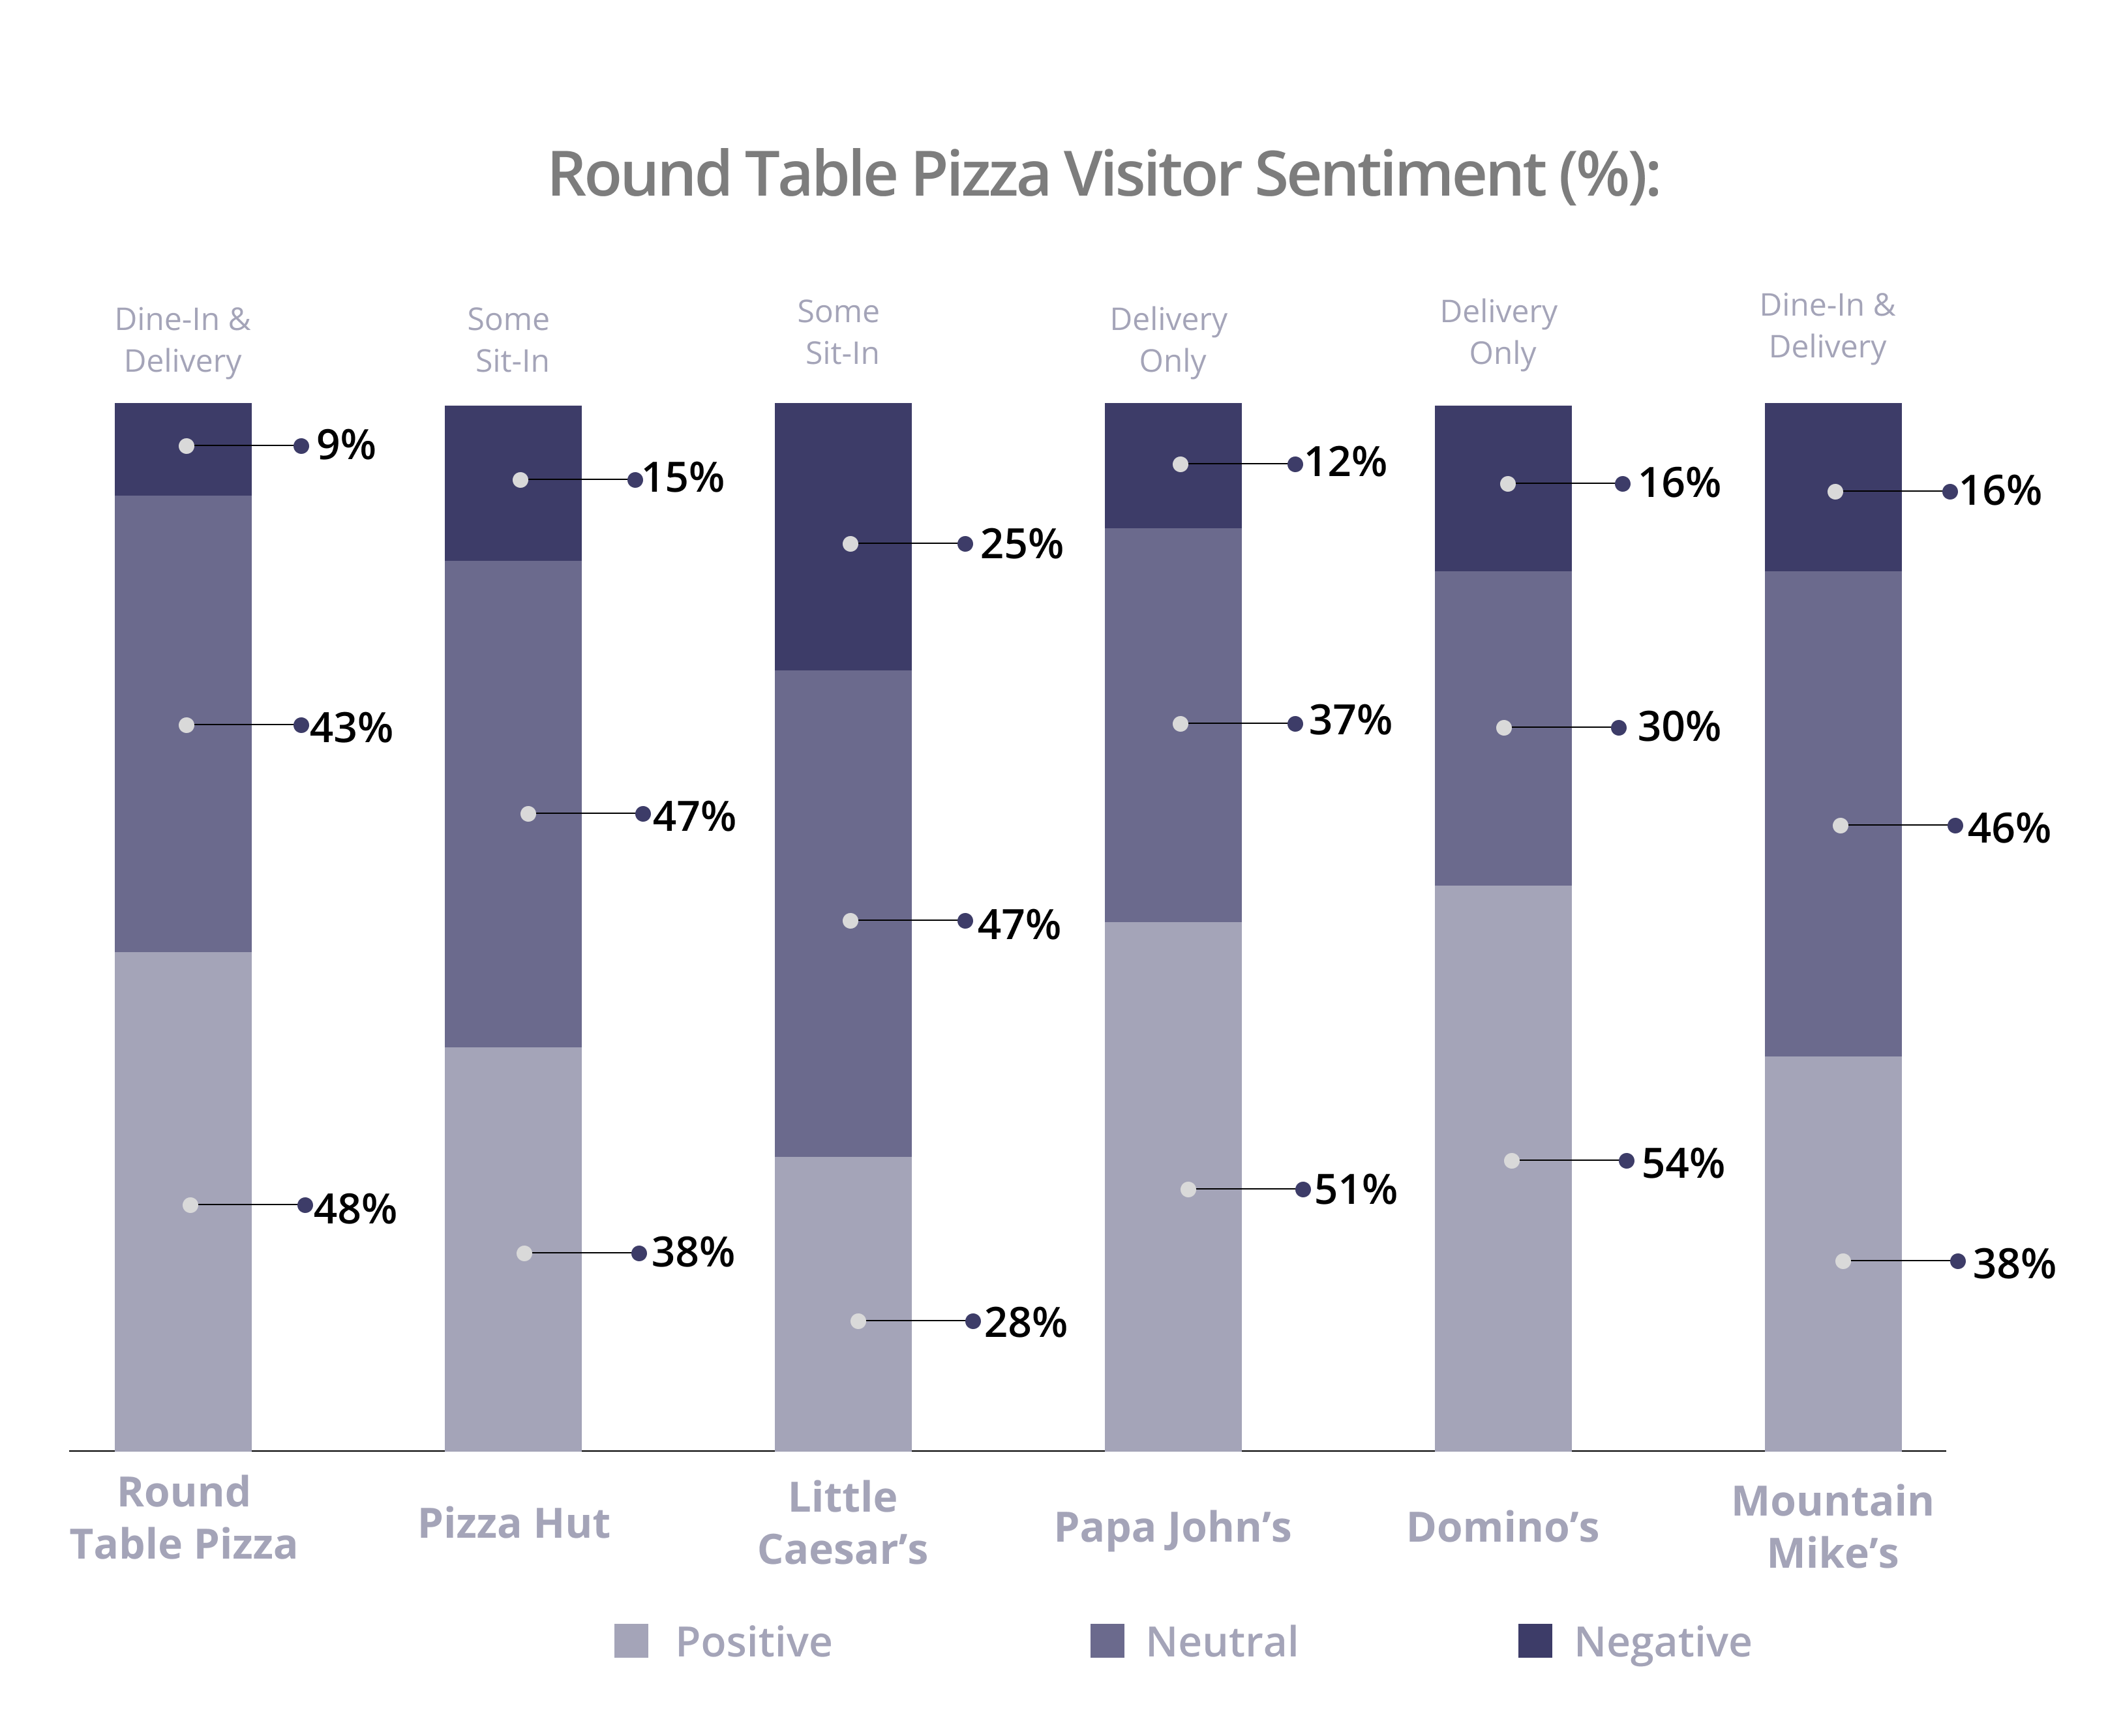
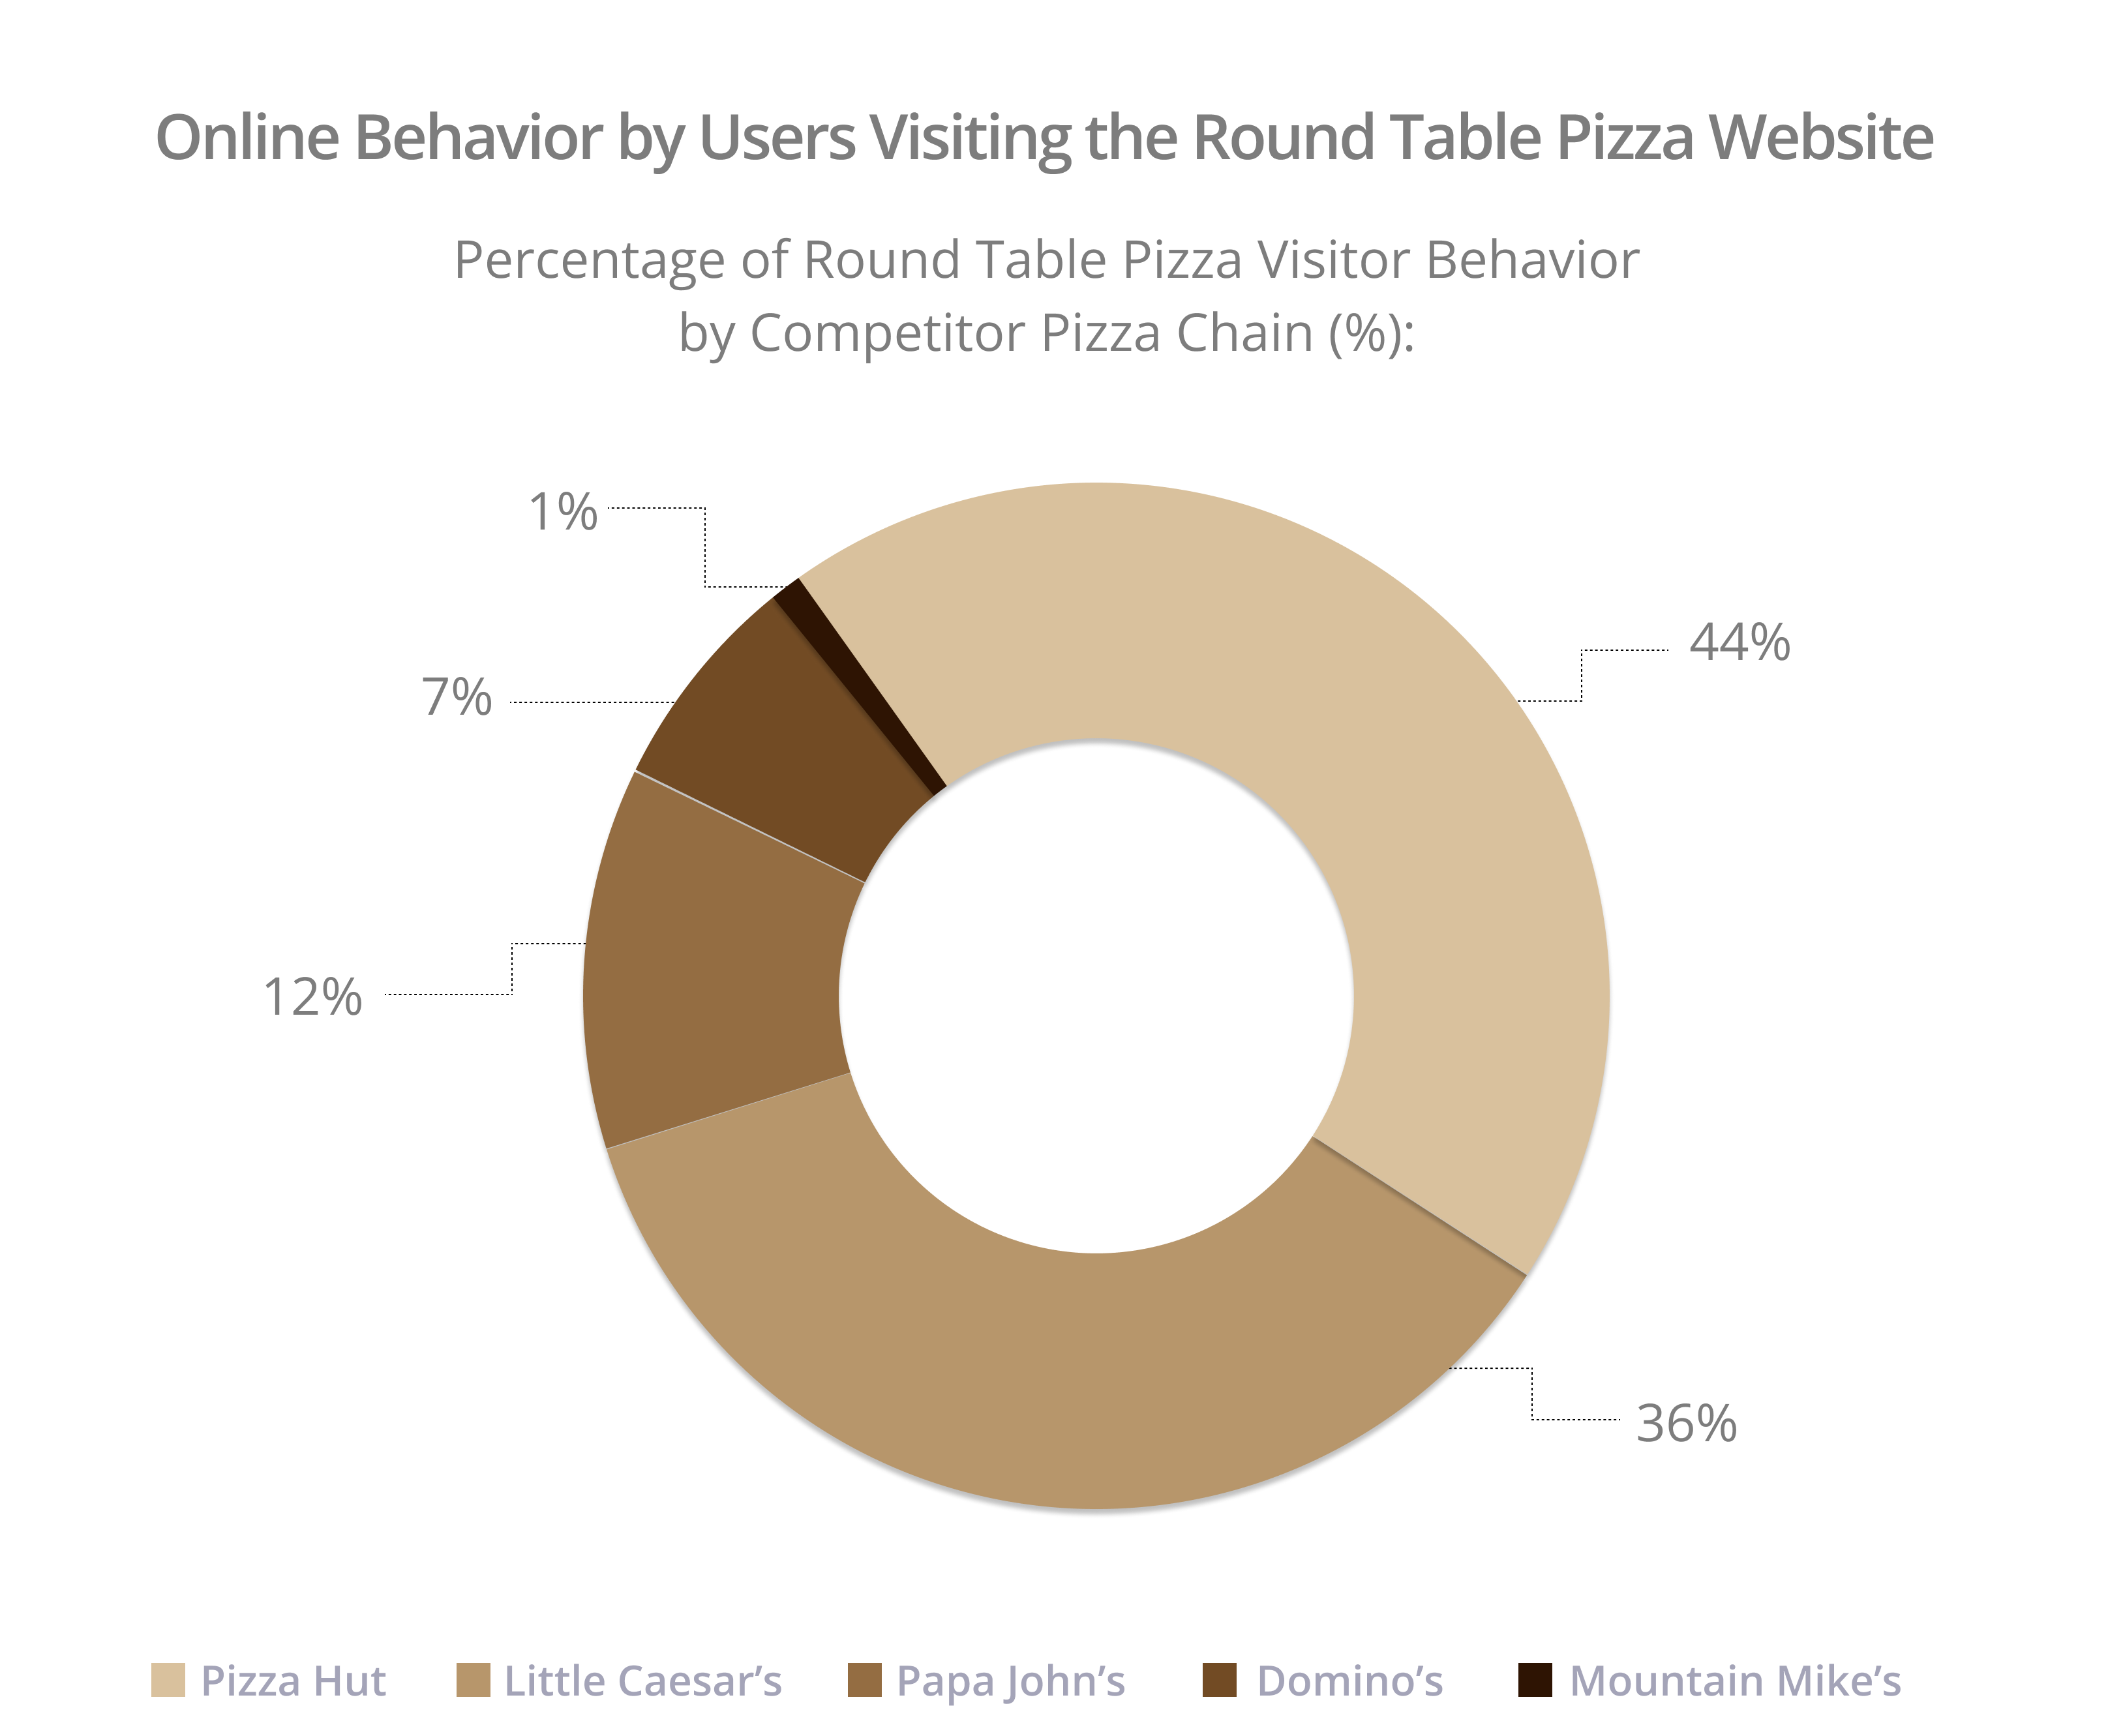
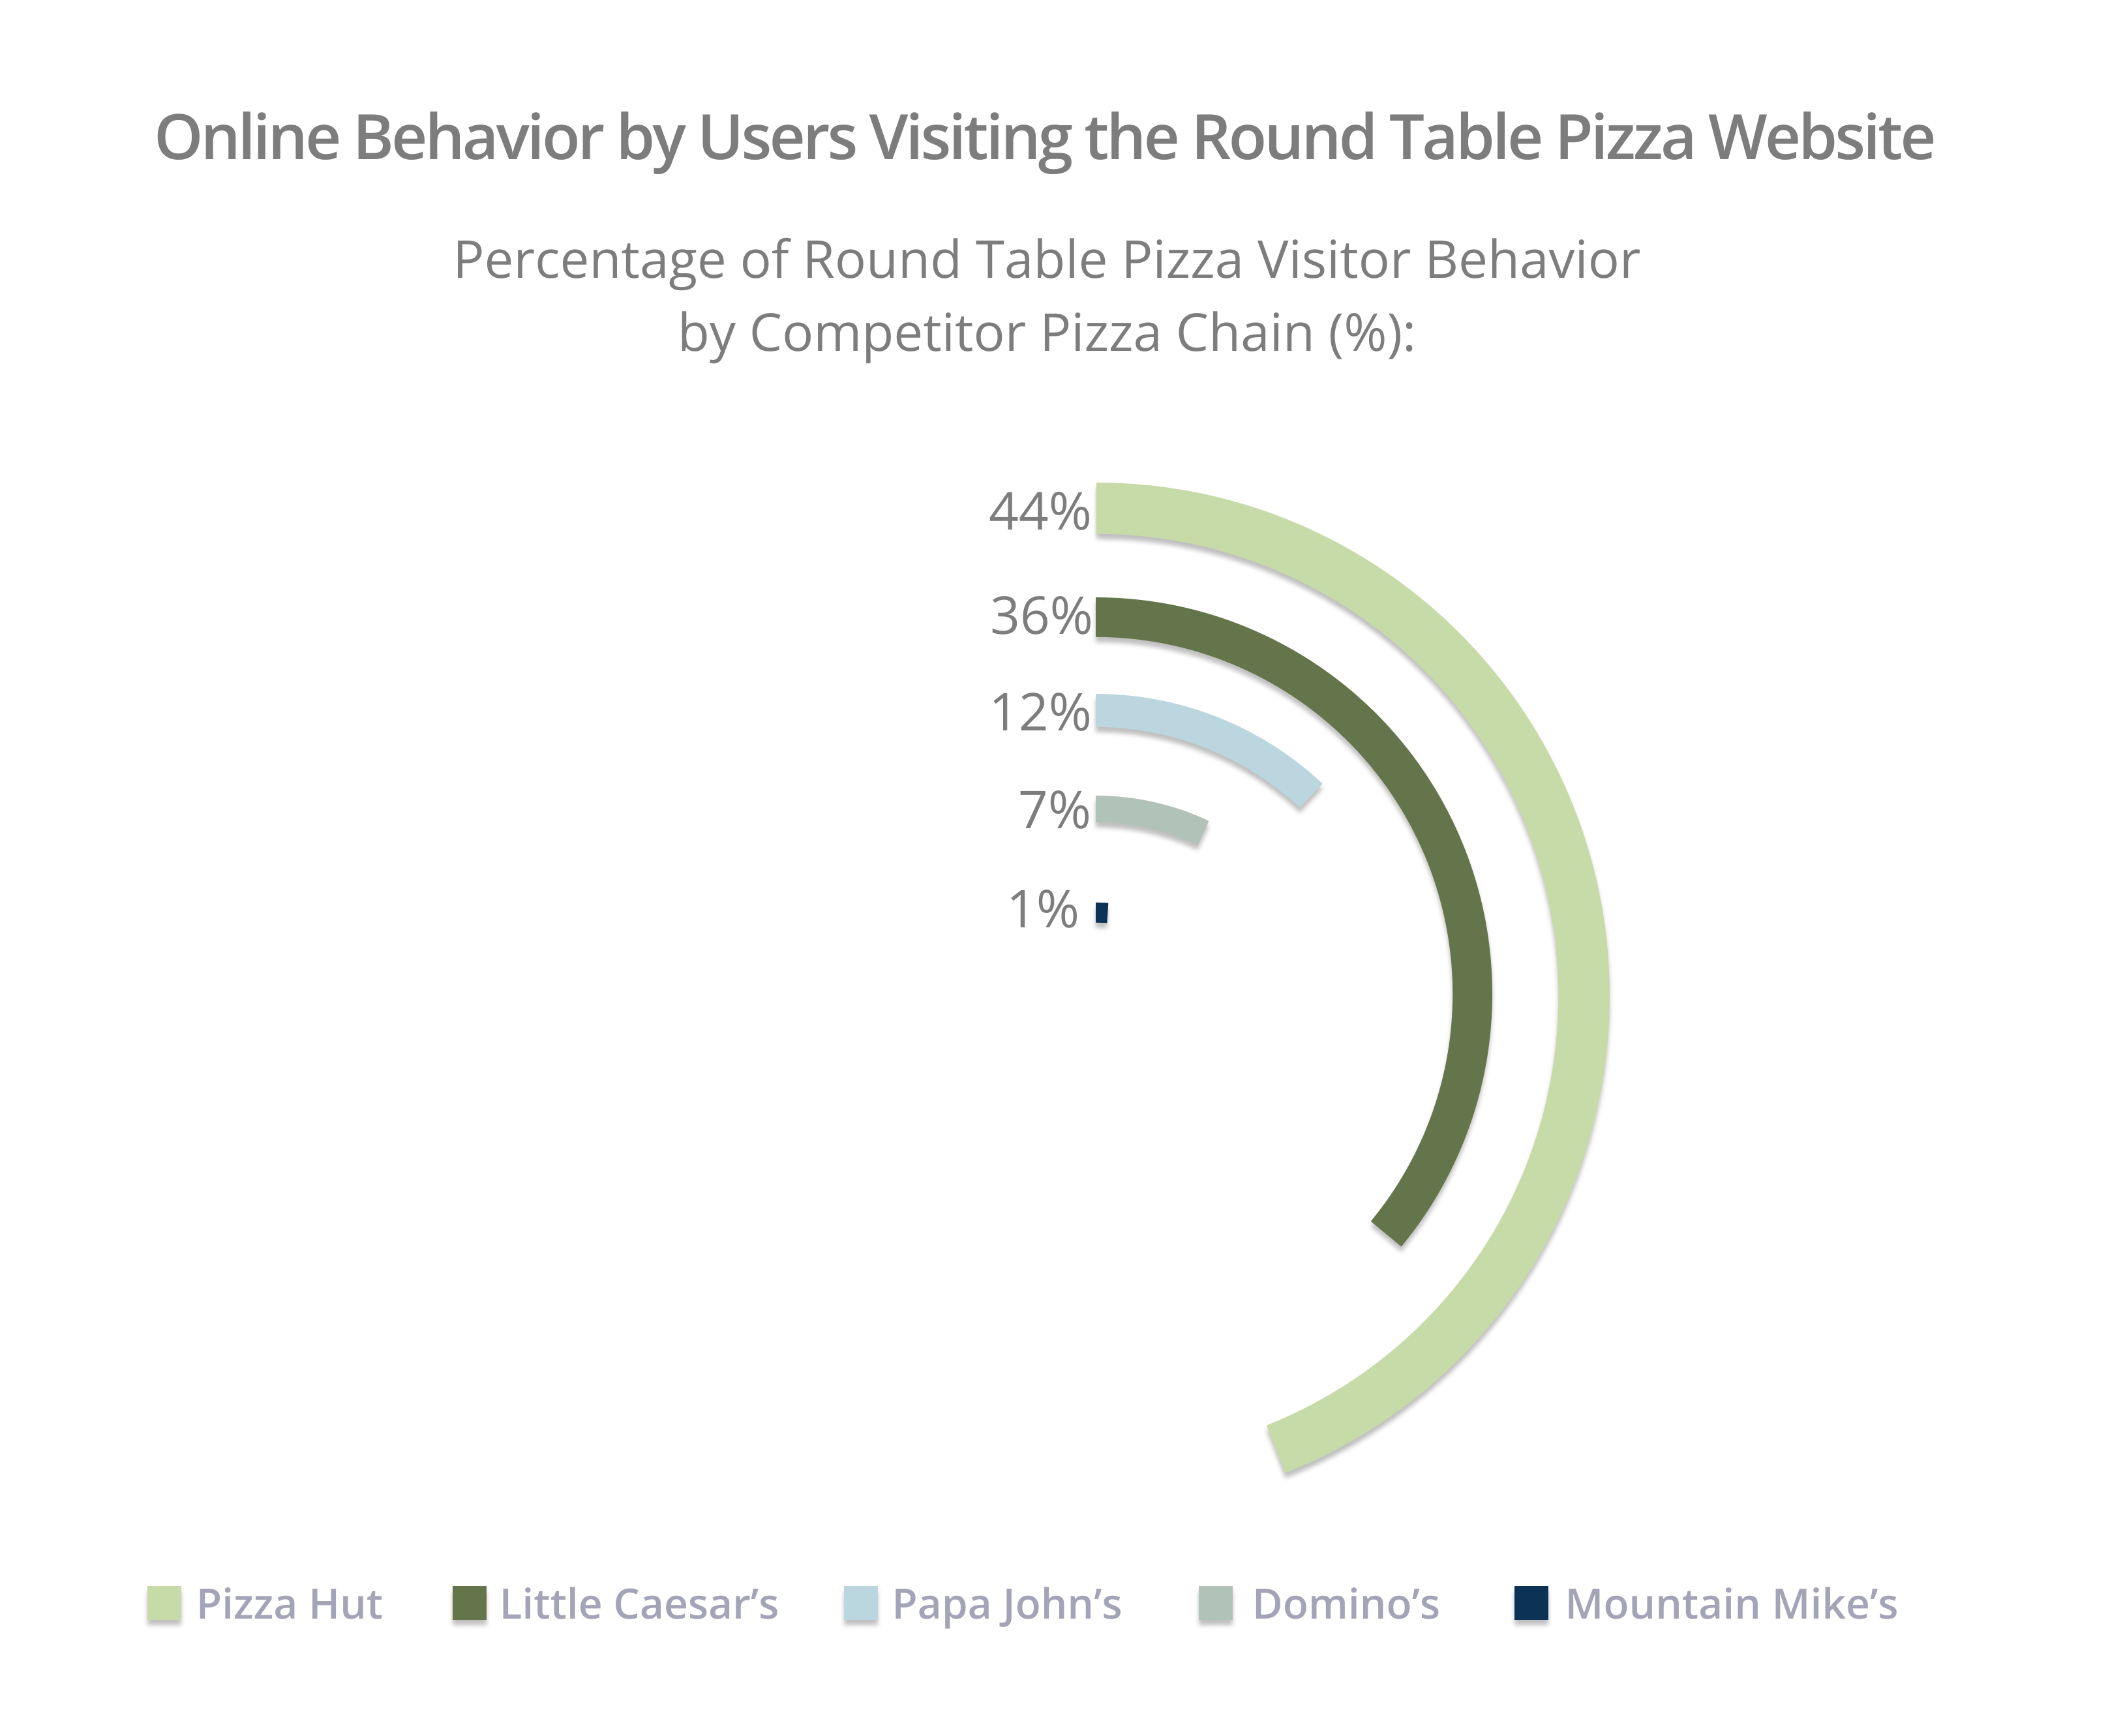
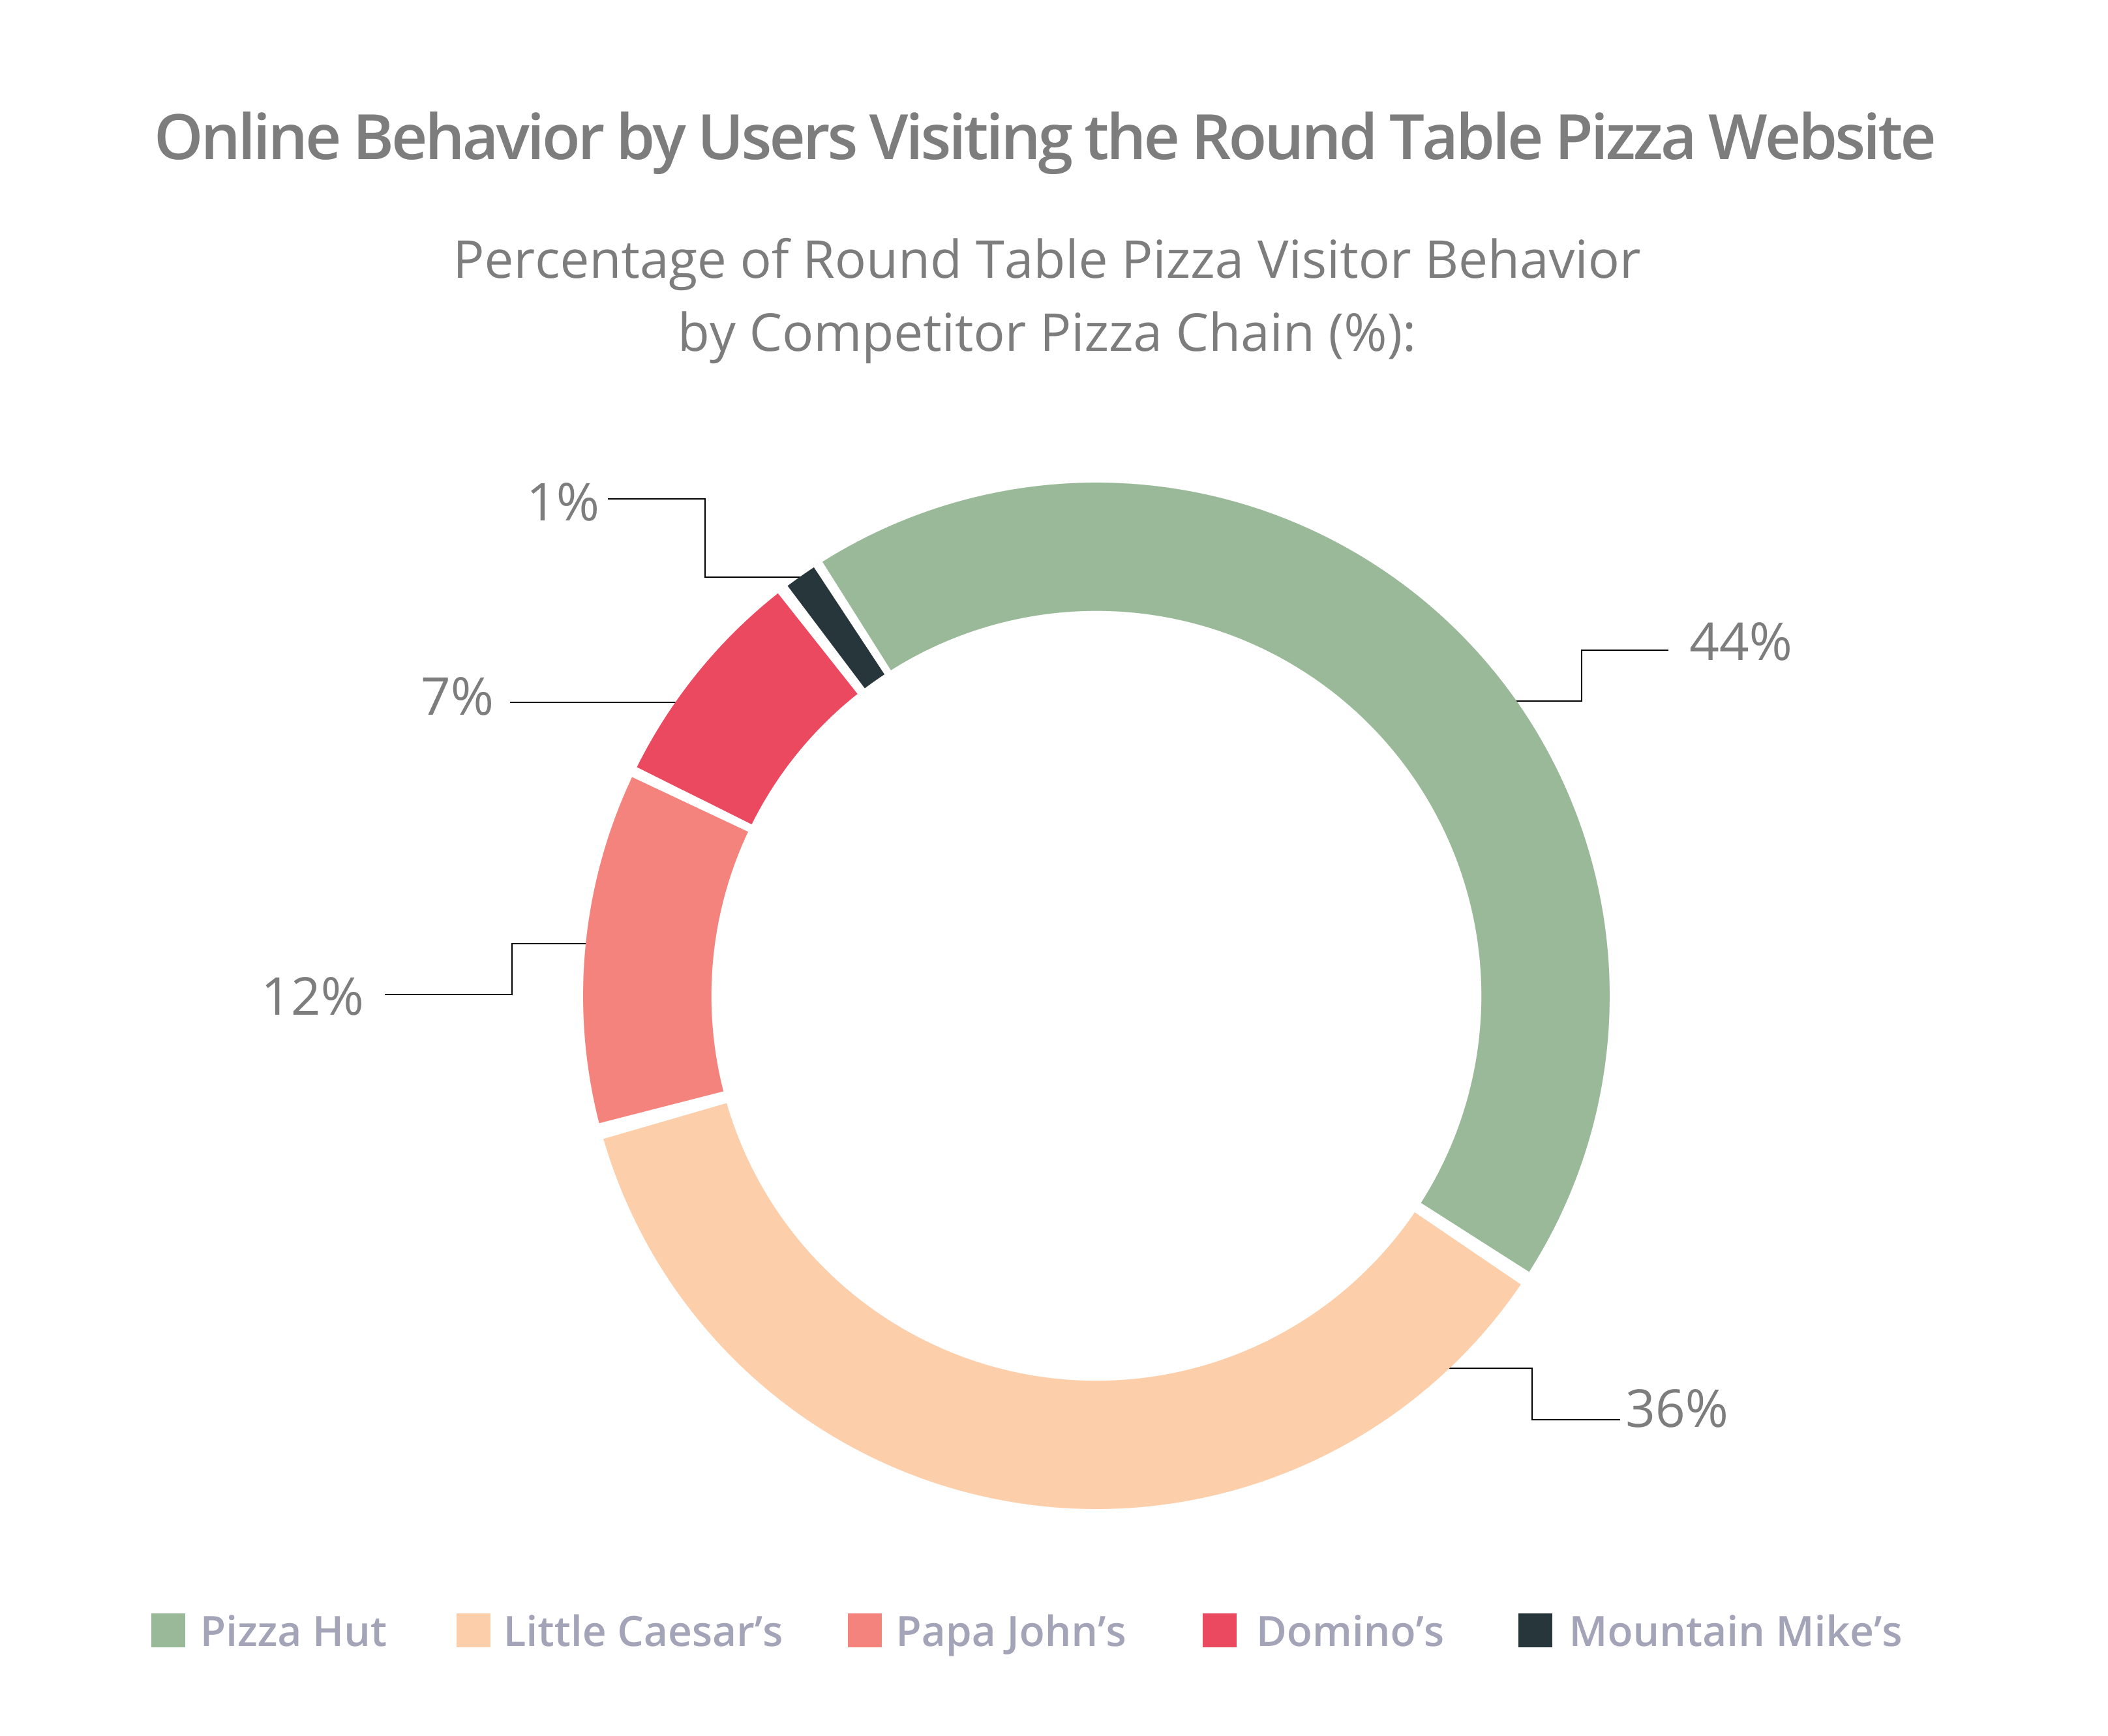
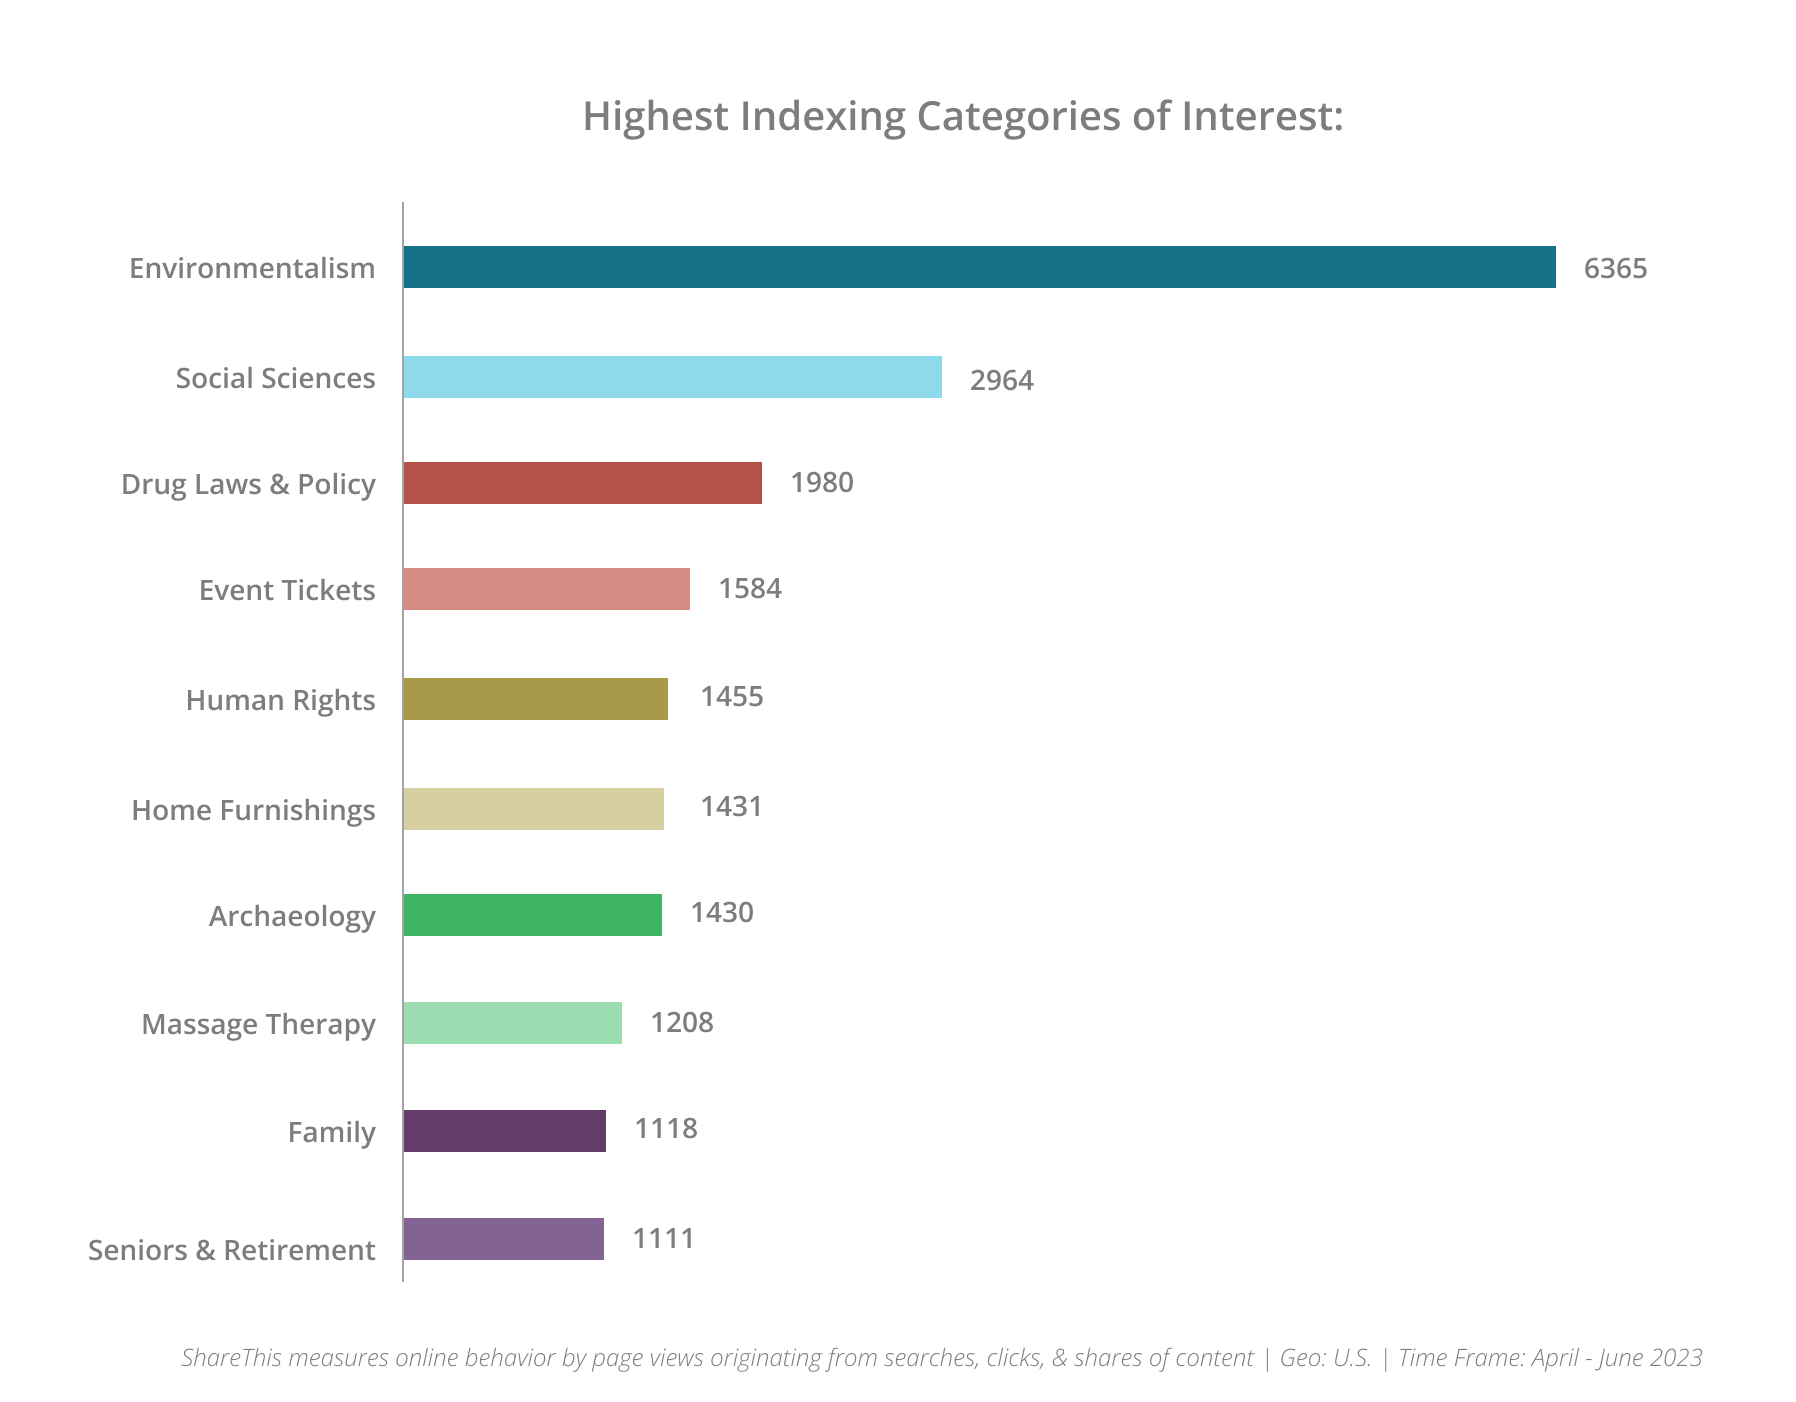
Designed how different data types would render across various chart styles—scatter plots, area charts, heat maps, box & whisker plots, stacked bar charts, radar graphs, and Gantt charts—thoughtfully balancing text, color, and hierarchy to transform raw inputs into clear, compelling visual stories tailored to client needs.
Using this as a inspo:


Options for the connect new icon: